
| 00:30 |
|
India Auto Industry Performance |
Monthly
|
Data
|
Transportation
|
|
|
| 02:00 |
|
|
UK Index of Production |
Monthly
|
Data
|
Industry
|
|
| 02:00 |
|
Germany Wholesale Prices |
Monthly
|
Data
|
Prices
|
|
|
| 02:00 |
|
|
UK Monthly GDP |
Monthly
|
Data
|
GDP
|
|
| 02:00 |
|
|
UK Index of Services |
Monthly
|
Data
|
Services
|
|
| 02:00 |
|
UK Construction Output |
Monthly
|
Data
|
Construction
|
|
|
| 02:00 |
|
|
UK International Trade |
Monthly
|
Data
|
Trade
|
|
| 03:00 |
|
|
Spain CPI |
Monthly
|
Data
|
Prices
|
|
| 03:45 |
|
|
France CPI |
Monthly
|
Data
|
Prices
|
|
| 05:00 |
|
|
Italy Industrial Production |
Monthly
|
Data
|
Industry
|
|
| 05:00 |
|
|
Euro Area Industrial Production |
Monthly
|
Data
|
Industry
|
|
| 06:00 |
|
IATA Chart of the Week |
Weekly
|
Commentary
|
Transportation
|
|
|
| 08:00 |
|
NIESR Monthly GDP Tracker |
Monthly
|
Data
|
GDP
|
||
|
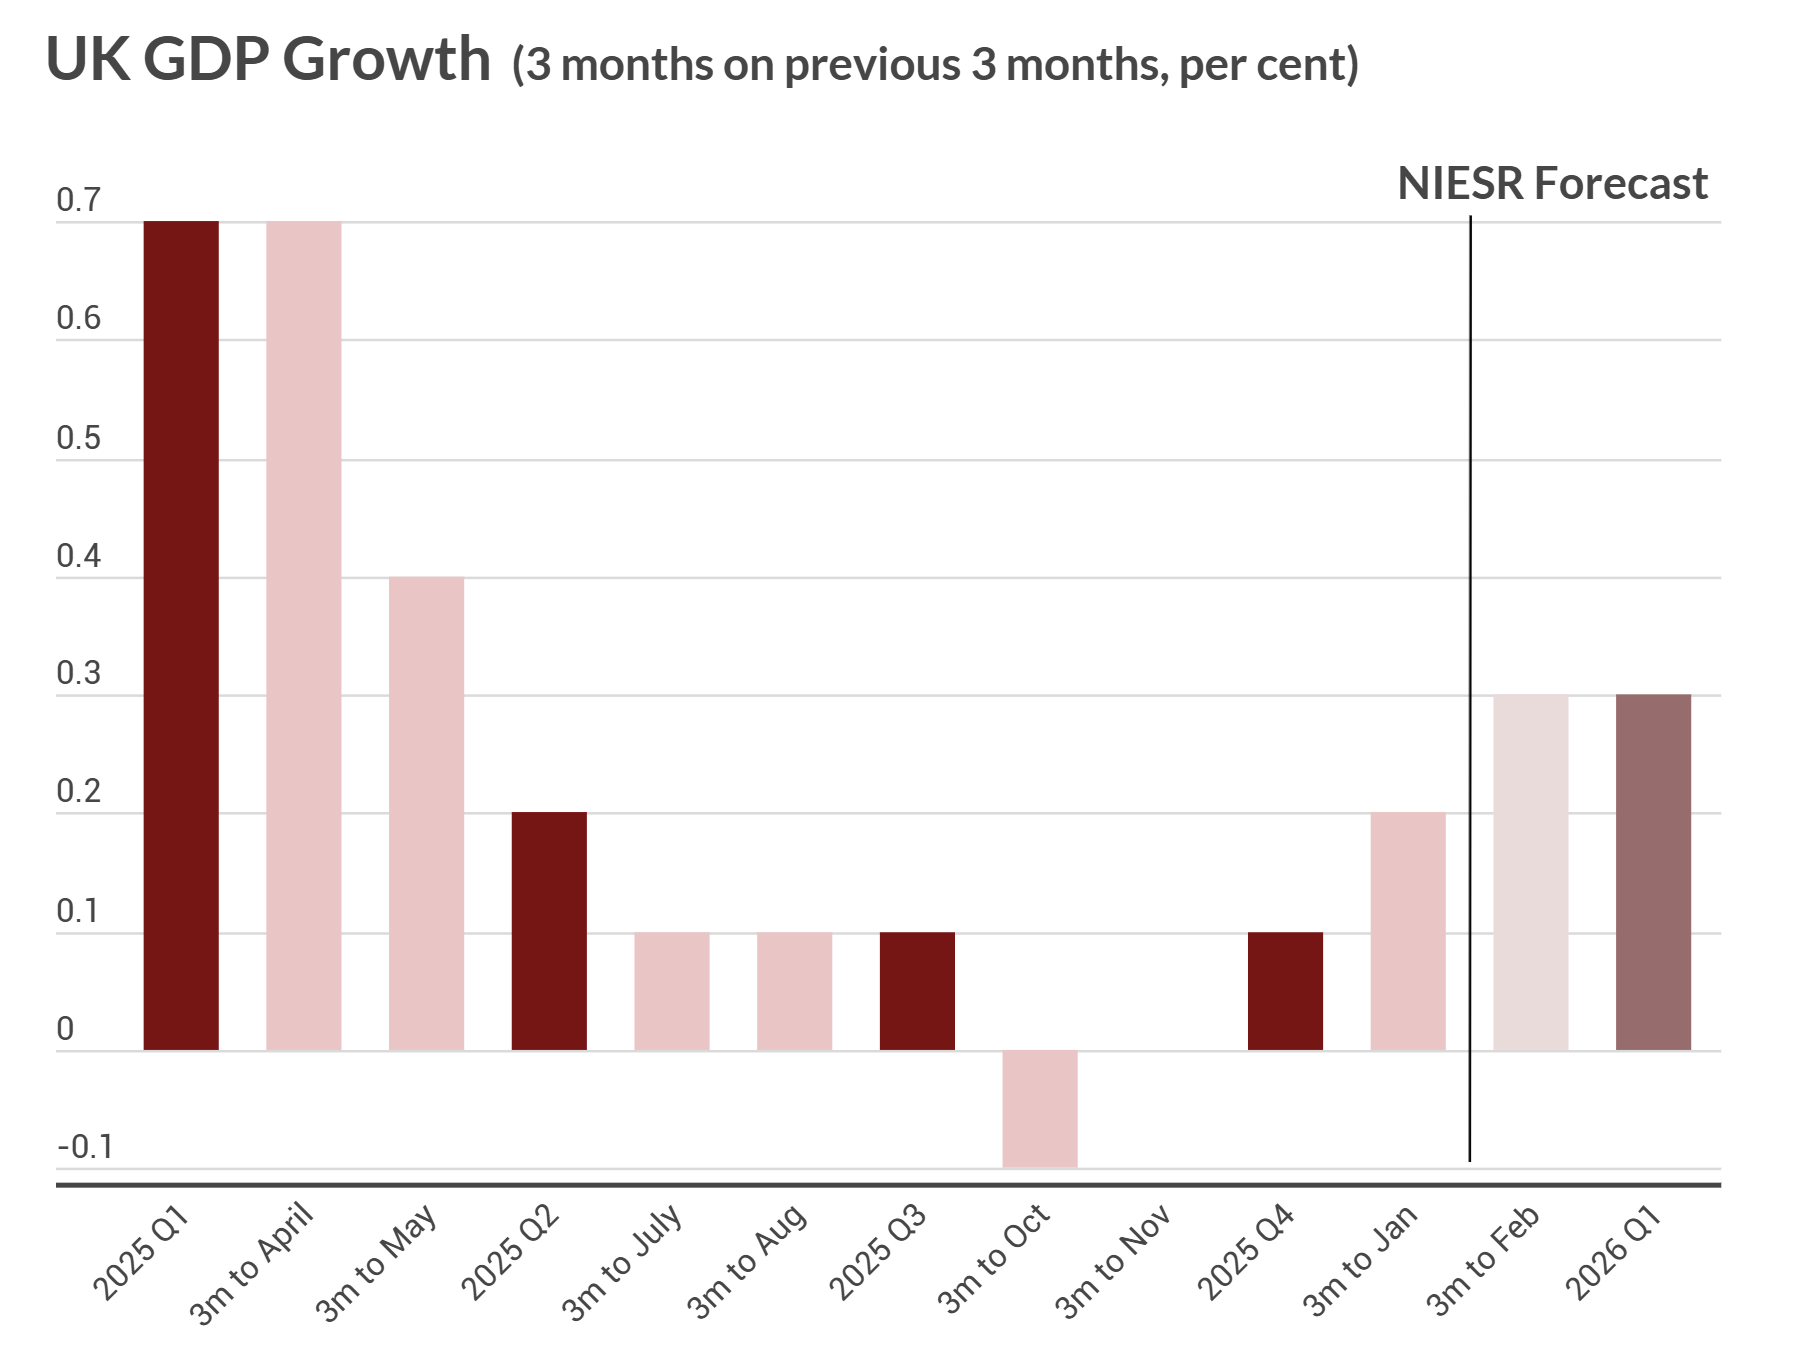
GDP stagnated in January. Peripheral sectors (construction and agriculture) reported positive monthly growth while services registered zero growth and production showed a second consecutive monthly contraction.
|
|||||||
| 08:30 |
|
|
US GDP |
Quarterly
|
Data
|
GDP
|
|
|
|
|||||||
| 08:30 |
|
|
US Personal Income and Outlays |
Monthly
|
Data
|
Consumption
|
|
|
|
|||||||
| 08:30 |
|
|
Canada Employment |
Monthly
|
Data
|
Employment
|
|
| 08:30 |
|
|
Canada Manufacturing Sales |
Monthly
|
Data
|
Industry
|
|
| 08:30 |
|
|
US Manufacturers' Shipments, Inventories, and Orders |
Monthly
|
Data
|
Industry
|
|
|
|
|||||||
| 10:00 |
|
|
UMich Index of Consumer Sentiment |
Semi-Monthly
|
Data
|
Sentiment
|
|
|
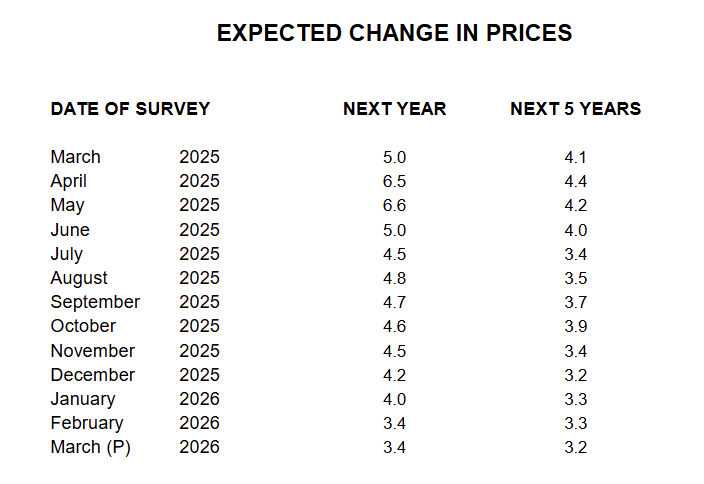
This month, year-ahead inflation expectations ended six months of consecutive declines, stalling at 3.4%. The current reading exceeds those seen in 2024 and remains well above the 2.3-3.0% range seen in the two years pre-pandemic. Long-run inflation expectations inched down to 3.2%. In 2024, readings ranged between 2.8% and 3.2%, while in 2019 and 2020, they were consistently below 2.8%. Note that for both time horizons, interviews completed after February 28th exhibited higher inflation expectations than those completed before that date (see chart, right panel).
|
|||||||
| 10:00 |
|
|
JOLTS Survey |
Monthly
|
Data
|
Employment
|
|
|
|
|||||||
| 10:00 |
|
Cox Automotive Used Vehicle Inventory |
Monthly
|
Data
|
Transportation
|
||
| 11:45 |
|
New York Fed Staff Nowcast |
Weekly
|
Outlook
|
GDP
|
||
|
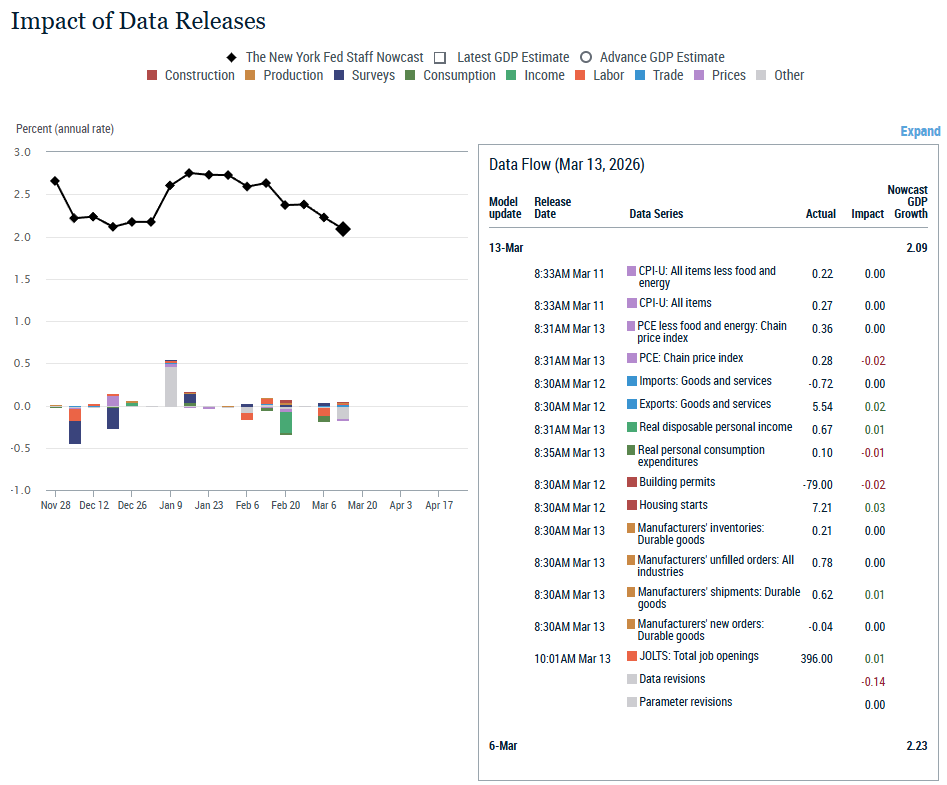
The New York Fed Staff Nowcast for 2026 Q1 is 2.1%, with the 50% probability interval at [0.8, 3.2]% and the 80% probability interval at [-0.1, 4.2]%.
|
|||||||
| 12:00 |
|
CIBC The Week Ahead |
Weekly
|
Commentary
|
Macro
|
||
| 12:40 |
|
MTSI Commentary |
Commentary
|
Macro
|
|
||
| 13:00 |
|
Baker Hughes Rig Count |
Weekly
|
Data
|
Energy
|
||
| 15:00 |
|
Cass Freight Index |
Monthly
|
Data
|
Transportation
|
||
| 16:00 |
|
USDA Wheat Outlook |
Monthly
|
Outlook
|
Agriculture
|
||
| 16:00 |
|
Wells Fargo Weekly Economic and Financial Commentary |
Weekly
|
Commentary
|
Macro
|
||
| 16:00 |
|
USDA Feed Outlook |
Monthly
|
Outlook
|
Agriculture
|
||
| 16:00 |
|
USDA Oil Crops Outlook |
Monthly
|
Outlook
|
Agriculture
|
||
| 16:00 |
|
USDA Cotton and Wool Outlook |
Monthly
|
Outlook
|
Agriculture
|
||
| 16:00 |
|
USDA Rice Outlook |
Monthly
|
Outlook
|
Agriculture
|
||
| 16:30 |
|
Wells Fargo Looking Ahead |
Weekly
|
Commentary
|
Markets
|
||
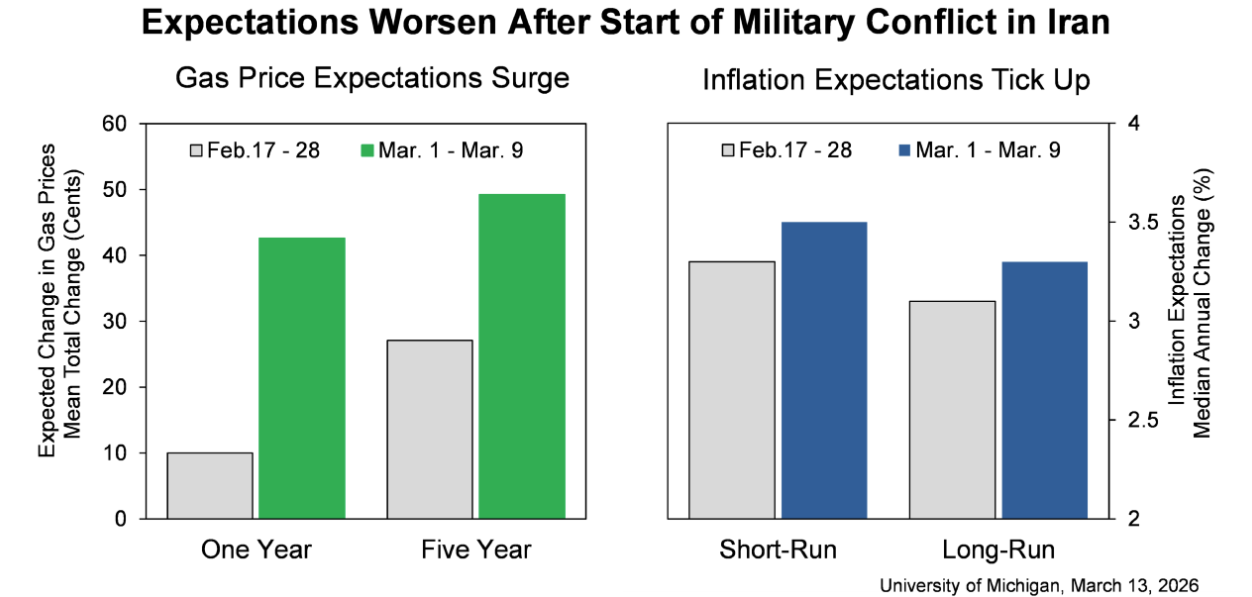 Consumer sentiment dipped about 2%, reaching its lowest reading of the year. Interviews completed prior to the military action in Iran showed an improvement in sentiment from last month, but lower readings seen during the nine days thereafter completely erased those initial gains. Gasoline prices have exerted the most immediate impact felt by consumers, though the magnitude of passthrough to other prices remains highly uncertain. A broad swath of consumers across incomes, age, and political affiliation all reported declines in expectations for their personal finances, down 7.5% nationally. Interviews for this release were collected between February 17 and March 9, with about half completed after the start of the US military conflict in Iran.
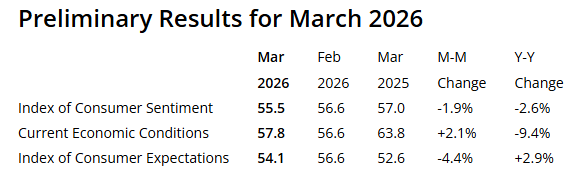
| 04:00 |
|
PBoC Financial Statistics |
Monthly
|
Data
|
Monetary Policy
|
||
| 07:00 |
|
Bank of England Inflation Attitudes Survey |
Quarterly
|
Data
|
Prices
|
| 05:00 |
|
Global Debt Report |
Annually
|
Data
|
Credit/Debt
|
||
| 20:30 |
|
ACCI-Westpac Business Survey |
Quarterly
|
Data
|
Industry
|
||
| 22:00 |
|
|
China Retail Sales |
Monthly
|
Data
|
Consumption
|
|
| 22:00 |
|
|
China Real Estate Investment |
Monthly
|
Data
|
Macro
|
|
| 22:00 |
|
China House Price Index |
Monthly
|
Data
|
Real Estate
|
||
| 22:00 |
|
|
China Industrial Production |
Monthly
|
Data
|
Industry
|
|
| 22:00 |
|
|
China Fixed Asset Investment |
Monthly
|
Data
|
Macro
|
| 01:30 |
|
India Wholesale Price Index |
Monthly
|
Data
|
Prices
|
||
| 04:30 |
|
S&P Global UK Consumer Sentiment Index |
Monthly
|
Data
|
Sentiment
|
||
| 05:00 |
|
IEA Monthly Electricity Statistics |
Monthly
|
Data
|
Energy
|
||
| 05:00 |
|
BIS Quarterly Review |
Quarterly
|
Research
|
Macro
|
||
| 06:00 |
|
OECD Economic Outlook |
Quarterly
|
Outlook
|
Macro
|
||
| 06:00 |
|
G20 GDP Growth |
Quarterly
|
Data
|
GDP
|
||
| 07:00 |
|
|
IBC-Br Economic Activity Index |
Monthly
|
Data
|
Macro
|
|
| 07:00 |
|
BlackRock Global Weekly Commentary |
Weekly
|
Commentary
|
Markets
|
||
| 07:00 |
|
Capital Economics Chief Economist's Note |
Weekly
|
Commentary
|
Macro
|
||
| 07:00 |
|
JPMorgan Weekly Market Recap |
Weekly
|
Commentary
|
Markets
|
||
| 08:15 |
|
Canada Housing Starts |
Monthly
|
Data
|
Real Estate
|
||
| 08:30 |
|
|
Canada CPI |
Monthly
|
Data
|
Prices
|
|
| 08:30 |
|
|
NY Fed Empire State Manufacturing Survey |
Monthly
|
Data
|
PMI
|
|
| 08:30 |
|
Chicago Fed Advance Retail Trade Summary (CARTS) |
Semi-Monthly
|
Data
|
Macro
|
||
| 09:00 |
|
GasBuddy Weekly Gas Price Report |
Weekly
|
Commentary
|
Energy
|
||
| 09:00 |
|
HPW Labor Market Tightness Index |
Monthly
|
Data
|
Employment
|
||
| 09:00 |
|
S&P Global This Week in Credit |
Weekly
|
Commentary
|
Credit
|
||
| 09:15 |
|
|
US Industrial Production |
Monthly
|
Data
|
Industry
|
|
| 09:30 |
|
Small Business Checkpoint |
Monthly
|
Commentary
|
Macro
|
||
| 10:00 |
|
Cox Automotive New Vehicle Affordability Index |
Monthly
|
Data
|
Transportation
|
||
| 10:00 |
|
Cox Automotive Auto Market Weekly |
Weekly
|
Commentary
|
Macro
|
||
| 10:00 |
|
TransUnion Credit Industry Snapshot |
Monthly
|
Data
|
Credit/Debt
|
||
| 10:00 |
|
|
US Business Inventories |
Monthly
|
Data
|
Macro
|
|
| 10:00 |
|
Cox Automotive EV Market Monitor |
Monthly
|
Data
|
Transportation
|
||
| 11:00 |
|
SCE Credit Access Survey |
Tri-Annual
|
Data
|
Credit/Debt
|
||
| 12:00 |
|
IATA Jet Fuel Price Monitor |
Weekly
|
Data
|
Energy
|
||
| 15:00 |
|
Merrill Lynch Capital Market Outlook |
Weekly
|
Commentary
|
Markets
|
||
| 23:30 |
|
Japan Current Survey of Commerce |
Monthly
|
Data
|
Consumption
|
| 00:30 |
|
|
RBA Monetary Policy Decision |
Monetary Policy Decision
|
Monetary Policy
|
||
| 00:30 |
|
Japan Indices of Tertiary Industry Activity |
Monthly
|
Data
|
Services
|
||
| 02:45 |
|
France Labor Cost Index |
Monthly
|
Data
|
Employment
|
||
| 05:00 |
|
ZEW Indicator of Economic Sentiment Germany |
Monthly
|
Data
|
Sentiment
|
||
| 05:00 |
|
|
Italy CPI |
Monthly
|
Data
|
Prices
|
|
| 08:15 |
|
ADP Weekly Preliminary Employment Report |
Weekly
|
Data
|
Employment
|
||
| 08:30 |
|
|
NY Fed Business Leaders Survey |
Monthly
|
Data
|
Sentiment
|
|
| 08:55 |
|
Redbook Retail Sales Index |
Weekly
|
Data
|
Consumption
|
||
| 10:00 |
|
EIA Gasoline and Diesel Fuel Update |
Weekly
|
Data
|
Energy
|
||
| 10:00 |
|
NAHB Housing Market Index |
Monthly
|
Data
|
Real Estate
|
||
| 10:00 |
|
US Pending Home Sales |
Monthly
|
Data
|
Real Estate
|
||
| 12:00 |
|
Freightos Weekly Update |
Weekly
|
Commentary
|
Transportation
|
||
| 15:00 |
|
USDA Sugar & Sweeteners Outlook |
Monthly
|
Outlook
|
Agriculture
|
||
| 15:00 |
|
USDA Livestock, Dairy, and Poultry Outlook |
Monthly
|
Outlook
|
Agriculture
|
||
| 15:00 |
|
Fannie Mae Economic & Housing Outlook |
Monthly
|
Outlook
|
Real Estate
|
||
| 16:00 |
|
Westpac McDermott Miller Consumer Confidence Index |
Quarterly
|
Data
|
Sentiment
|
||
| 16:30 |
|
API Crude Oil Stock Change |
Weekly
|
Data
|
Energy
|
||
| 19:50 |
|
|
Japan International Trade |
Monthly
|
Data
|
Trade
|
| 00:00 |
|
Mizuho EMEA G4 Rates & FX Monthly |
Commentary
|
Macro
|
|||
| 00:30 |
|
|
Japan Industrial Production |
Monthly
|
Data
|
Industry
|
|
| 02:00 |
|
|
UK Employment |
Monthly
|
Data
|
Employment
|
|
| 05:00 |
|
|
Euro Area Labor Costs |
Quarterly
|
Data
|
Employment
|
|
| 05:00 |
|
Euro Area Construction Production |
Monthly
|
Data
|
Construction
|
||
| 06:00 |
|
CBI Industrial Trends Survey |
Monthly
|
Data
|
Macro
|
||
| 07:00 |
|
Bundesbank Monthly Report |
Monthly
|
Commentary
|
Macro
|
||
| 07:00 |
|
CFIB Business Barometer |
Monthly
|
Data
|
Sentiment
|
||
| 07:00 |
|
|
Bank of England Monetary Policy Decision |
Monetary Policy Decision
|
Monetary Policy
|
||
| 08:00 |
|
Bank of England Weekly Report |
Weekly
|
Data
|
Monetary Policy
|
||
| 08:15 |
|
|
ECB Monetary Policy Decision |
Monetary Policy Decision
|
Monetary Policy
|
||
| 08:30 |
|
|
Philadelphia Fed Manufacturing Business Outlook Survey |
Monthly
|
Data
|
Industry
PMI
|
|
| 08:30 |
|
|
US Unemployment Insurance |
Weekly
|
Data
|
Employment
|
|
| 09:45 |
|
Drewry World Container Index |
Weekly
|
Data
|
Shipping
|
||
| 10:00 |
|
Visa Spending Momentum: Global |
Monthly
|
Data
|
Consumption
|
||
| 10:00 |
|
US Wholesale Inventories |
Monthly
|
Data
|
Macro
|
||
| 10:00 |
|
St Louis Fed Financial Stress Index |
Weekly
|
Data
|
Markets
|
||
| 10:00 |
|
|
US New Home Sales |
Monthly
|
Data
|
Real Estate
|
|
| 10:00 |
|
J.D. Power Automotive Forecast |
Monthly
|
Data
|
Transportation
|
||
| 10:30 |
|
|
EIA Natural Gas Storage Report |
Weekly
|
Data
|
Energy
|
|
| 11:30 |
|
Weekly Economic Index |
Weekly
|
Data
|
Macro
|
||
| 12:00 |
|
AAA Gas Prices |
Weekly
|
Data
|
Energy
|
||
| 12:00 |
|
Freddie Mac Mortgage Rates |
Weekly
|
Data
|
Real Estate
|
||
| 15:00 |
|
Creighton Rural Mainstreet Index |
Monthly
|
Data
|
Agriculture
|
||
| 16:00 |
|
RBC Global Insight Weekly |
Weekly
|
Outlook
|
Macro
|
||
| 16:30 |
|
Federal Reserve Balance Sheet |
Weekly
|
Data
|
Monetary Policy
|
| 02:00 |
|
OBR Public Finances Commentary |
Monthly
|
Commentary
|
Government
|
||
| 02:00 |
|
|
Germany PPI |
Monthly
|
Data
|
Prices
|
|
| 02:00 |
|
UK Public Sector Borrowing |
Monthly
|
Data
|
Government
|
||
| 02:45 |
|
|
France Retail Sales |
Monthly
|
Data
|
Macro
|
|
| 03:45 |
|
France Business Creations |
Monthly
|
Data
|
Macro
|
||
| 04:00 |
|
|
Italy International Trade |
Monthly
|
Data
|
Trade
|
|
| 04:00 |
|
Italy Construction Production |
Monthly
|
Data
|
Construction
|
||
| 04:00 |
|
Euro Area Current Account |
Monthly
|
Data
|
Trade
|
||
| 05:00 |
|
|
Euro Area International Trade |
Monthly
|
Data
|
Trade
|
|
| 06:00 |
|
IATA Chart of the Week |
Weekly
|
Commentary
|
Transportation
|
||
| 08:30 |
|
|
Canada PPI |
Monthly
|
Data
|
Prices
|
|
| 08:30 |
|
|
Canada Retail Sales |
Monthly
|
Data
|
Consumption
|
|
| 08:30 |
|
Canada New Housing Price Index |
Monthly
|
Data
|
Real Estate
|
||
| 09:00 |
|
NY Fed DSGE Model Forecast |
Quarterly
|
Outlook
|
GDP
|
||
| 11:45 |
|
New York Fed Staff Nowcast |
Weekly
|
Outlook
|
GDP
|
||
| 12:00 |
|
MTSI Manufacturing PMI Composite Indexes |
Weekly
|
Data
|
PMI
|
||
| 12:00 |
|
CIBC The Week Ahead |
Weekly
|
Commentary
|
Macro
|
||
| 12:00 |
|
MTSI Services PMI Composite Indexes |
Weekly
|
Data
|
PMI
|
||
| 13:00 |
|
Baker Hughes Rig Count |
Weekly
|
Data
|
Energy
|
||
| 16:00 |
|
Wells Fargo Weekly Economic and Financial Commentary |
Weekly
|
Commentary
|
Macro
|
||
| 16:30 |
|
Wells Fargo Looking Ahead |
Weekly
|
Commentary
|
Markets
|
| 05:00 |
|
China Foreign Direct Investment |
Monthly
|
Data
|
Macro
|