
 AAR Rail Industry Overview
- Source
- Association of American Railroads
- Source Link
- https://www.aar.org/
- Frequency
- Monthly
- Next Release(s)
- May 4th, 2026 11:00 AM
Latest Updates
-
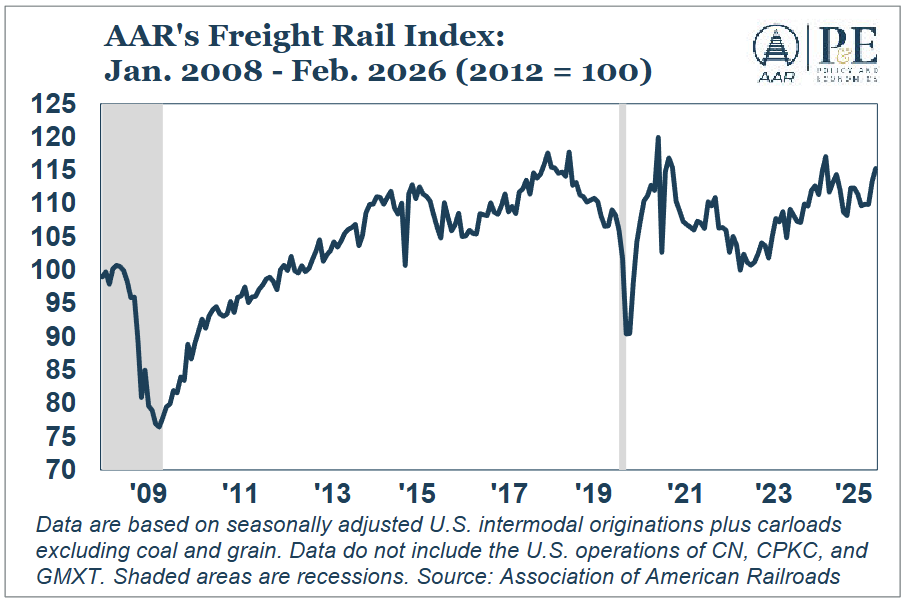
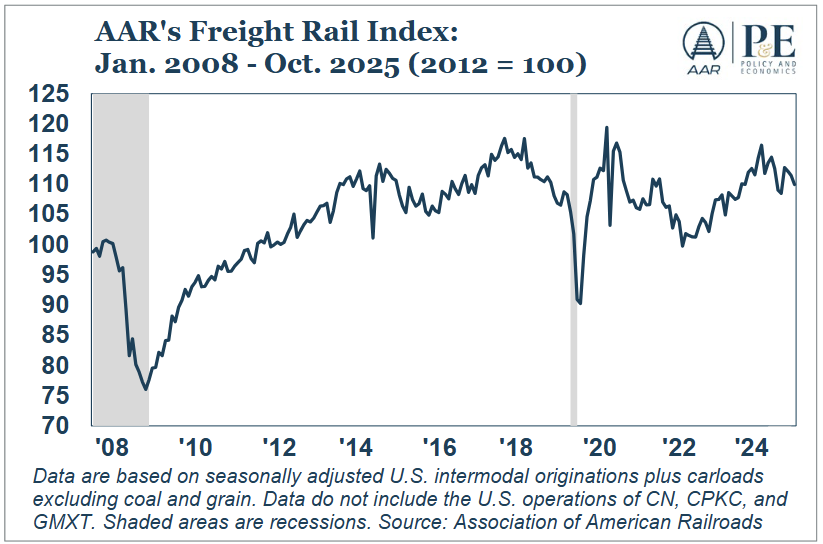
The AAR Freight Rail Index (FRI) tracks seasonally adjusted intermodal shipments and carloads excluding coal and grain, which together capture the rail traffic segments most sensitive to shifts in the broader economy. The index rose 1.8% in February over January, its third month-to-month increase in the past four months.
- Coal: In February 2026, coal carloads were up 6.9% over February 2025. Carloads averaged 58,659 per week in February, the most since September 2025. Carloads for the first two months of 2026 were up 5.8%, or nearly 26,000 carloads, over last year. So far in 2026, coal accounts for 26.6% of non-intermodal rail volume, well ahead of chemicals (15.3%) and grain (11.2%). Rail coal shipments have been supported by a combination of cold weather, firmer natural gas prices, and elevated electricity demand. Together, those factors have improved coal burn economics and helped lift rail coal volumes early in the year.
- Carloads Excluding Coal: U.S. carloads excluding coal rose 6.3% in February, their strongest year-over-year percentage gain in more than two years. Carloads excluding coal have seen year-over-year increases in 22 of the past 25 months, showing that freight demand outside coal has remained more resilient than many headline indicators might suggest. For the year to date through February, carloads were up 5.4% and, at 1.29 million, were the most since 2015.
- Grain: U.S. grain carloads averaged 25,018 per week in February 2026, the highest weekly average for February since 1990 and the highest for any month since January 2021. For the first two months of 2026, grain carloads were up 21.8% over last year and were the most since 1990 (when a typical grain car held much less grain than today). Most variation in grain carloads reflects changes in export demand, and grain exports have been strengthening. The USDA recently projected that U.S. corn exports will set a record this year. Because corn accounts for roughly half of U.S. grain carloads, that export strength is translating directly into stronger rail volume.
- Chemicals: U.S. rail carloads of chemicals entered 2026 with solid momentum, building on a record-setting performance in 2025. In February, chemical carloads rose 3.3% over last year. Average weekly chemical carloads in February were 34,606, the most ever for any month. In the first two months of 2026, chemical carloads totaled more than 269,000, up 2.9% over last year and a record for the first two months of a year. Looking ahead, geopolitical tensions in the Middle East bear watching because they could put upward pressure on natural gas prices. A sustained rise would weigh on the competitiveness of energy-intensive U.S. chemical production, which could eventually soften chemical carloads even as higher natural gas prices support coal demand.
- Motor Vehicles & Parts: North American rail carloads of motor vehicles rose 3.1% in February, their first year-over-year gain in six months, and weekly average carloads reached their highest level in five months. Still, the outlook remains mixed. The National Automobile Dealers Association recently forecast new vehicle sales at 16.0 million in 2026, down from 16.2 million in 2025. Affordability pressures remain significant, with higher sticker prices and elevated monthly payments continuing to sideline many buyers. At the same time, labor market uncertainty and policy-related volatility are complicating both production planning and consumer demand. Motor vehicles account for roughly 8% of U.S. rail revenue.
- A Decline in Railcars in Storage: The number of railcars in storage fell by nearly 18,000 in Febru¬ary, their first decline in six months, and every major railcar category saw fewer idled cars. If that trend continues, it would suggest freight demand is strengthening enough for railroads and other railcar owners to bring equipment back into service in a more meaningful way.
-
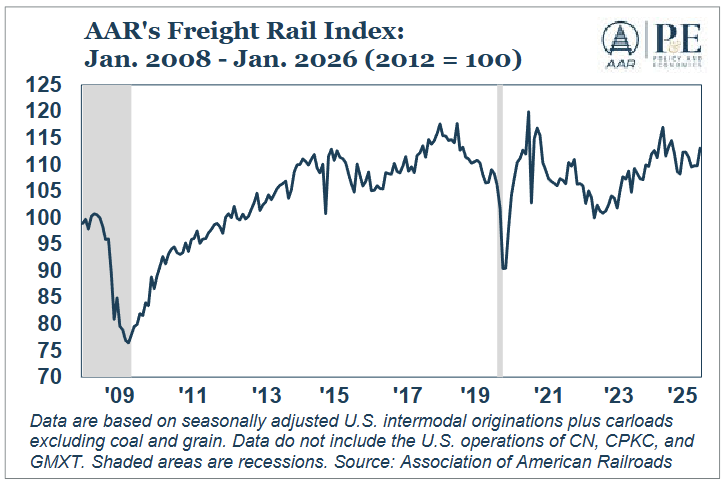
The AAR Freight Rail Index rose +3.1% MoM in January 2026, reflecting a short-term pickup in economy-sensitive rail volumes driven mainly by stronger carloads.
-
Coal carloads rose +4.7% YoY in January (+10.5k carloads), the largest monthly gain since May 2025, with YoY increases in 8 of the last 11 months amid short-term economic, weather, and policy support.
-
U.S. carloads excluding coal increased +4.3% YoY, marking the 21st YoY gain in the past 24 months, though gains remained modest alongside sluggish industrial and manufacturing activity.
-
Grain carloads averaged 24,355 per week, up +17.0% YoY and the highest since April 2021, reflecting stronger grain exports that remain central to overall rail volume growth.
-
Chemical carloads rose +2.4% YoY, their first increase after two monthly declines, following a record year in 2025 and indicating a firmer start to 2026.
-
Steel-related volumes were mixed: primary metal products fell -2.5% YoY (second decline in 11 months), iron and steel scrap surged +17.8% YoY (11th straight gain), and metallic ores fell -2.6% YoY for a 20th consecutive decline, highlighting structural shifts toward scrap-based steelmaking.
-
Railcars in storage totaled about 356k units (21.8% of the North American fleet) as of Feb. 1, with storage levels slowly increasing since mid-2025, signaling softer underlying transportation demand despite January’s rebound.
-
-
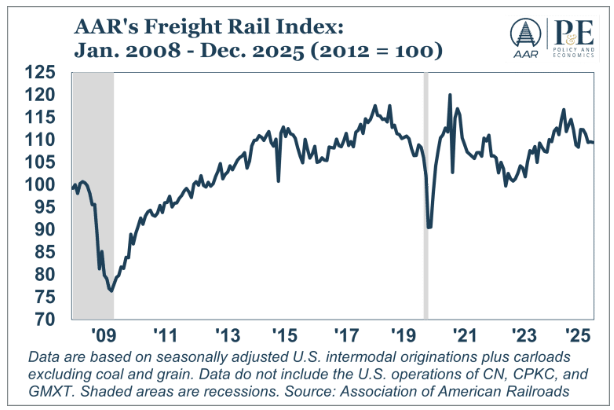
The AAR Freight Rail Index slipped in December and was down -6.3% YoY, marking its seventh decline in nine months and indicating weaker economy-sensitive rail volumes driven mainly by softer intermodal traffic.
-
The Freight Rail Index (FRI), which tracks seasonally adjusted intermodal shipments plus carloads excluding coal and grain, declined slightly in December, extending a downtrend that has produced 7 declines in the last 9 months.
-
U.S. carloads excluding coal fell -3.0% YoY in December, only the third YoY decline in 2025 and the fourth in the 24 months since January 2024, consistent with slow underlying industrial and manufacturing growth.
-
For full-year 2025, carloads excluding coal rose +1.0% YoY to 8.48M, the highest annual total since 2019, indicating modest growth in industrial-linked rail demand despite recent softness.
-
Grain carloads increased +2.9% YoY in December, representing the 10th YoY increase of 2025 and the 21st gain in the last 24 months; 2025 grain volumes rose +5.2% YoY to 1.12M, the most since 2021, reflecting stronger U.S. grain exports.
-
Coal volumes improved modestly in 2025, with rail coal carloads up +3.1% YoY (more than +92k carloads), alongside coal’s share of U.S. electricity generation rising to ~16.7% (from 15.2% in 2024) amid higher natural gas prices.
-
The EIA’s December 2025 outlook projected U.S. coal production down -2.2% in 2026 and coal consumption down -4.7%, with risks tied to fuel-price dynamics, regulatory interventions, and export-market conditions.
-
Chemical carloads fell -4.3% YoY in December and declined -1.3% in Q4 (their first quarterly drop since Q2 2023), though full-year chemical carloads still rose +0.8% YoY to 1.70M (a record), as earlier-year gains offset late-year weakness.
-
Steel-related volumes remained firm: primary metal products carloads rose +2.0% YoY in December (9th increase in the last 10 months) and were up +3.2% YoY in 2025, while iron and steel scrap carloads rose +9.2% YoY in December and +9.9% YoY in 2025 to 232,368 (the most since 2008).
-
-
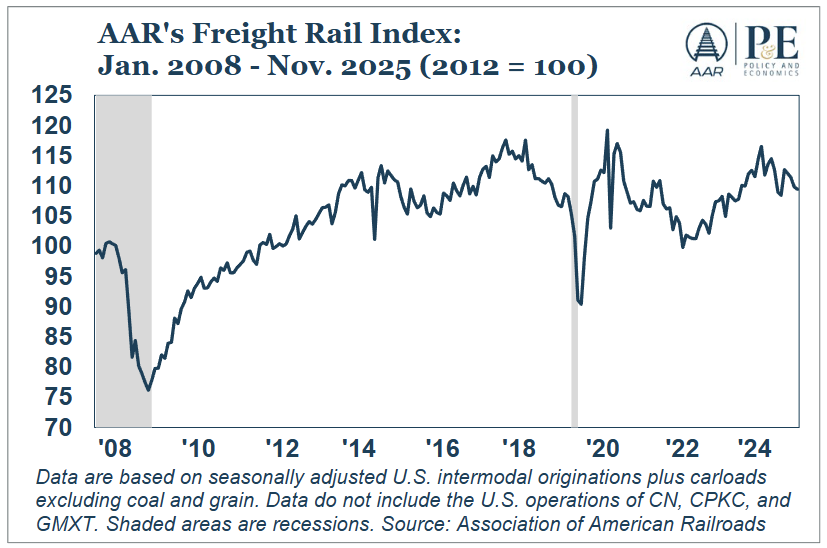
The AAR Freight Rail Index fell -0.4% MoM in November 2025 and was down -4.4% YoY, marking its seventh decline in eight months and underscoring weaker underlying freight demand driven largely by intermodal softness.
-
Grain carloads averaged 24,204 per week (+8.4% YoY), the highest since May 2021; year-to-date volumes were up 5.4%, supported by strong exports tied to competitive pricing and high crop quality.
-
Coal carloads averaged 58,382 per week (+3.1% YoY), their seventh increase in nine months, though November remained near historic lows; year-to-date volumes were +3.5%, helped by higher coal-fired electricity generation.
-
Carloads excluding coal rose 0.9% YoY, their eighth increase in nine months and the 20th in 22 months, with year-to-date volumes +1.3%, consistent with modest economic growth.
-
Chemical carloads fell -1.4% YoY, the third decline in six months, and averaged their lowest weekly level of 2025; however, year-to-date volumes were a record +1.3%, reflecting earlier strength before rising natural gas prices weighed on output.
-
Primary metal products declined -1.4% YoY, their first drop in nine months; despite the monthly pullback, year-to-date shipments were +3.4%, broadly in line with steel industry data.
-
Iron and steel scrap increased +11.1% YoY, the ninth straight rise, with year-to-date volumes +10.0%, the highest since 2011.
-
The industrial products category was essentially flat (-0.02% YoY), as gains in crushed stone and sand offset declines in autos, ores, and chemicals; the small change aligns with a generally sluggish manufacturing environment in 2025.
-
-
The AAR Freight Rail Index fell -1.4% MoM in October 2025 and -1.5% YoY, marking its sixth decline in seven months and reflecting a continued slowdown in underlying freight demand tied to industrial production and consumer goods flows.
-
Grain: Weekly carloads averaged 22,996 (-1.5% YoY) but were the highest since October 2024; YTD volumes were up +5.1%, the most since 2021.
-
Coal: Carloads averaged 57,375 (-2.9% YoY), the lowest October level since records began in 1988, though YTD volumes were still +3.5%, supported by earlier gains despite lower natural gas prices constraining coal-fired generation.
-
Ex-Coal: Carloads excluding coal rose +1.0% YoY, their seventh increase in eight months and 19th in 21 months; YTD volumes were +1.3%, the highest since 2019.
-
Chemicals: Carloads rose +1.8% YoY to an October record of 32,172 per week; YTD volumes reached a record 1.45M (+1.6%), underscoring resilient demand despite weaker manufacturing activity.
-
Primary Metal Products: Carloads increased +4.4% YoY, their eighth straight gain; YTD volumes were +3.7%, closely tracking higher domestic steel output (+4.6% YTD through September).
-
Iron & Steel Scrap: Volumes rose +13.5% YoY, also the eighth consecutive increase; YTD levels were +9.9%, the highest since 2011.
-
Industrial Products: The combined category rose +1.2% YoY, marking a sixth straight gain, supported by growth in chemicals and crushed stone that offset weaker autos and ores.
-
Grain Mill Products: Weekly carloads averaged 10,427 (+4.3% YTD), the highest on record, driven by strong soybean cake and meal shipments.
-
Overall, the data show continued strength in industrial-linked shipments such as chemicals and metals, offset by weakness in coal and modest declines in total freight activity.
-
-
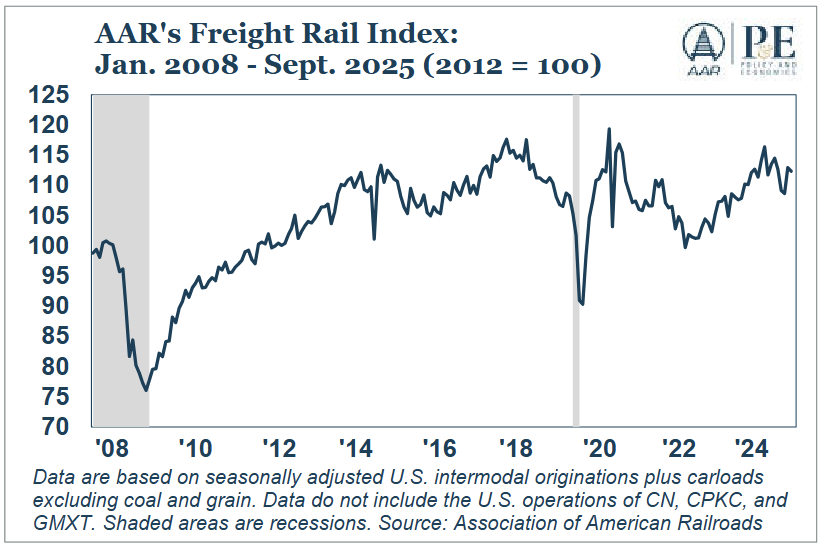
The AAR Freight Rail Index fell -0.8% MoM in September 2025, its fifth decline in six months, and was -1.0% YoY, reflecting gradual rather than sharp weakness in overall rail activity.
-
Grain: Carloads averaged 20,966 per week (+3.5% YoY), bringing year-to-date volumes up +6.0%, the highest since 2021.
-
Coal: Shipments fell -3.8% YoY, the first drop in seven months, though year-to-date volumes remained +4.4% higher than 2024, aided by a rebound from last year’s export disruptions.
-
Excluding Coal: Total carloads declined -0.2% YoY, ending a six-month growth streak, but remained +1.4% YTD and the highest since 2019.
-
Chemicals: Volumes dipped -0.7% YoY, only the second decline in 25 months, while YTD carloads reached a record 1.29 million (+1.5%).
-
Primary Metals: Shipments rose +2.3% YoY, their seventh consecutive increase; iron and steel scrap surged +18.4% YoY, with YTD scrap volumes up +9.4%, the most since 2011.
-
Industrial Products: The combined category (chemicals, paper, autos, steel, ores, and minerals) edged up +0.1% YoY, marking a fifth straight gain and underscoring steady industrial sector resilience despite wider manufacturing softness.
-
-
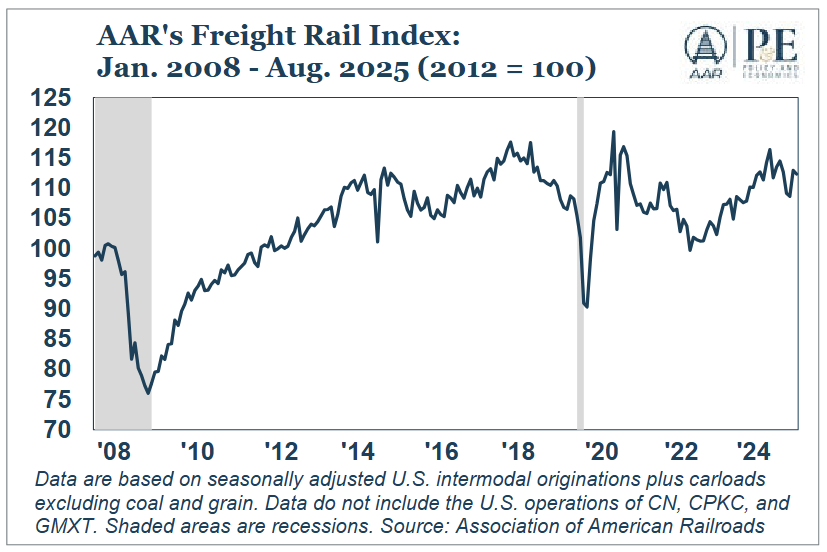
The AAR Freight Rail Index (FRI), which measures seasonally adjusted month-to-month rail intermodal shipments plus carloads excluding coal and grain, fell -0.5% MoM in August 2025 from July 2025, its fourth decline in the past five months. Still, the index remains relatively strong: since 2008, it’s been higher than it was in August less than 15% of the time.
-
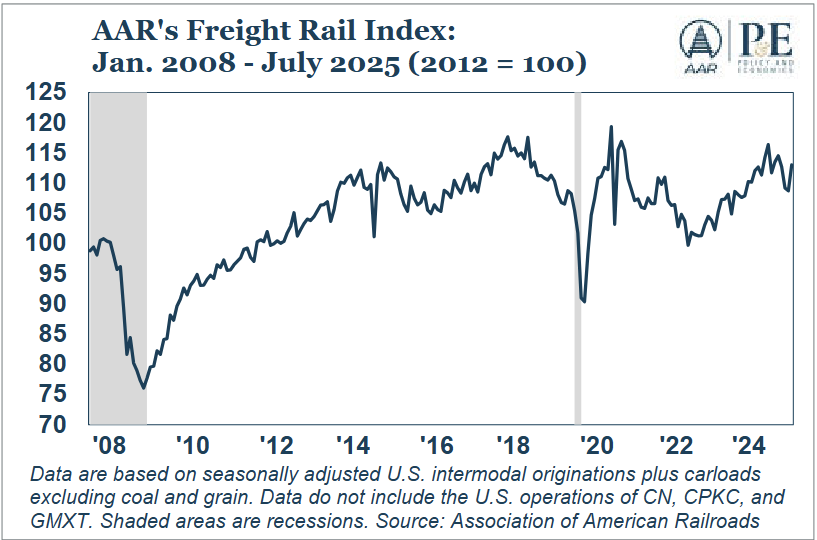
The AAR Freight Rail Index (FRI) measures seasonally adjusted rail volumes excluding coal and grain. The index rose 4.0% from June 2025 to July 2025, its first increase in four months, returning the index to its highest point in four months.
-
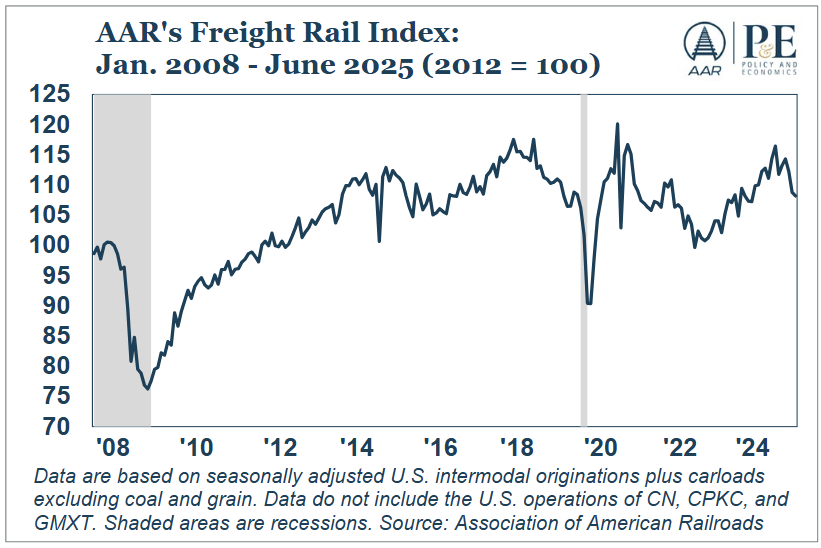
The AAR Freight Rail Index (FRI), a gauge of seasonally adjusted rail volumes excluding coal and grain, fell -0.5% MoM from May 2025 to June 2025, bringing the index to its lowest point since May 2024. June’s decline mainly reflects intermodal softness. Seasonally adjusted carloads excluding coal and grain and excluding intermodal rose 0.7% in June from May, reflecting pockets of strength for certain key rail sectors amid current economic uncertainties.
-
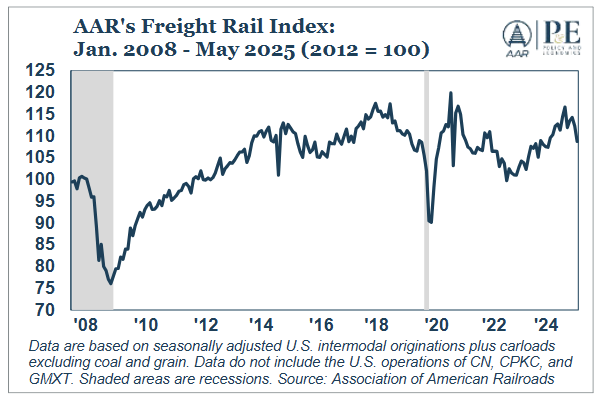
The AAR Freight Rail Index (FRI), which excludes coal and grain, fell -3.2% MoM in May from April—the sharpest monthly decline in five months and the lowest level in a year. This dip reflects broad-based softness in economically sensitive freight, especially intermodal, and hints at challenges for consumer goods and intermediate materials traffic.
-
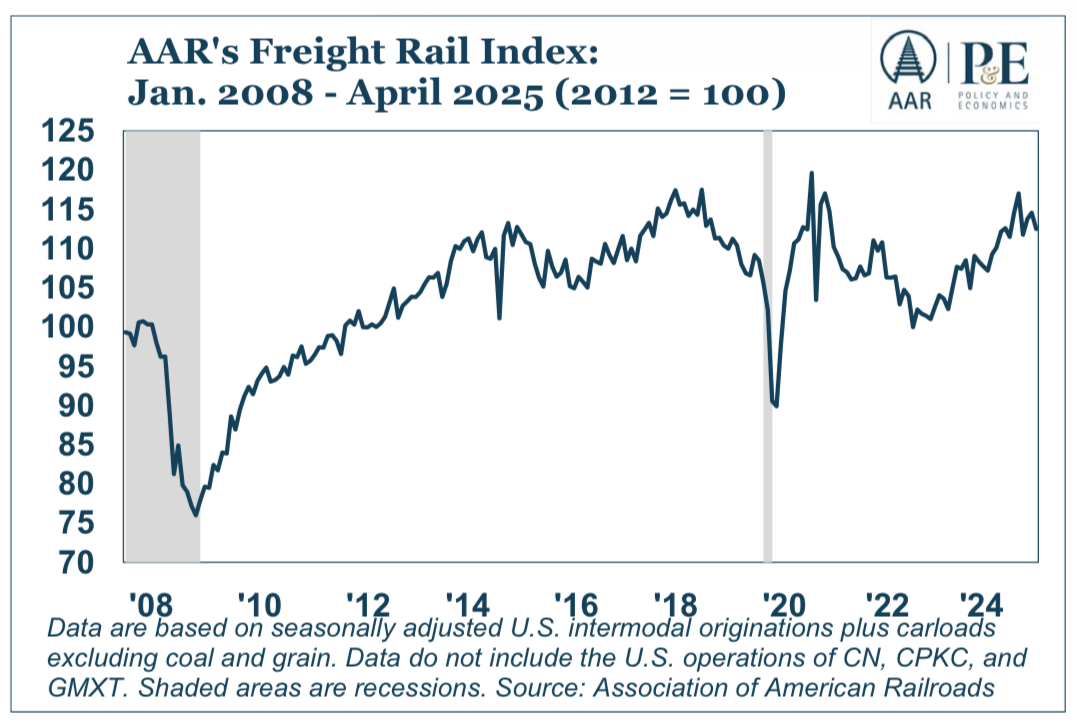
The AAR Freight Rail Index (FRI), which tracks seasonally adjusted intermodal units plus carloads excluding coal and grain, fell -1.8% MoM in April, following a 0.7% MoM increase in March.