
 US International Trade
- Source
- Bureau of Economic Analysis
- Source Link
- https://www.bea.gov/
- Frequency
- Monthly
- Next Release(s)
- May 5th, 2026 8:30 AM
-
June 9th, 2026 8:30 AM
-
July 7th, 2026 8:30 AM
-
August 4th, 2026 8:30 AM
-
September 3rd, 2026 8:30 AM
-
October 6th, 2026 8:30 AM
-
November 4th, 2026 8:30 AM
-
December 8th, 2026 8:30 AM
Latest Updates
-
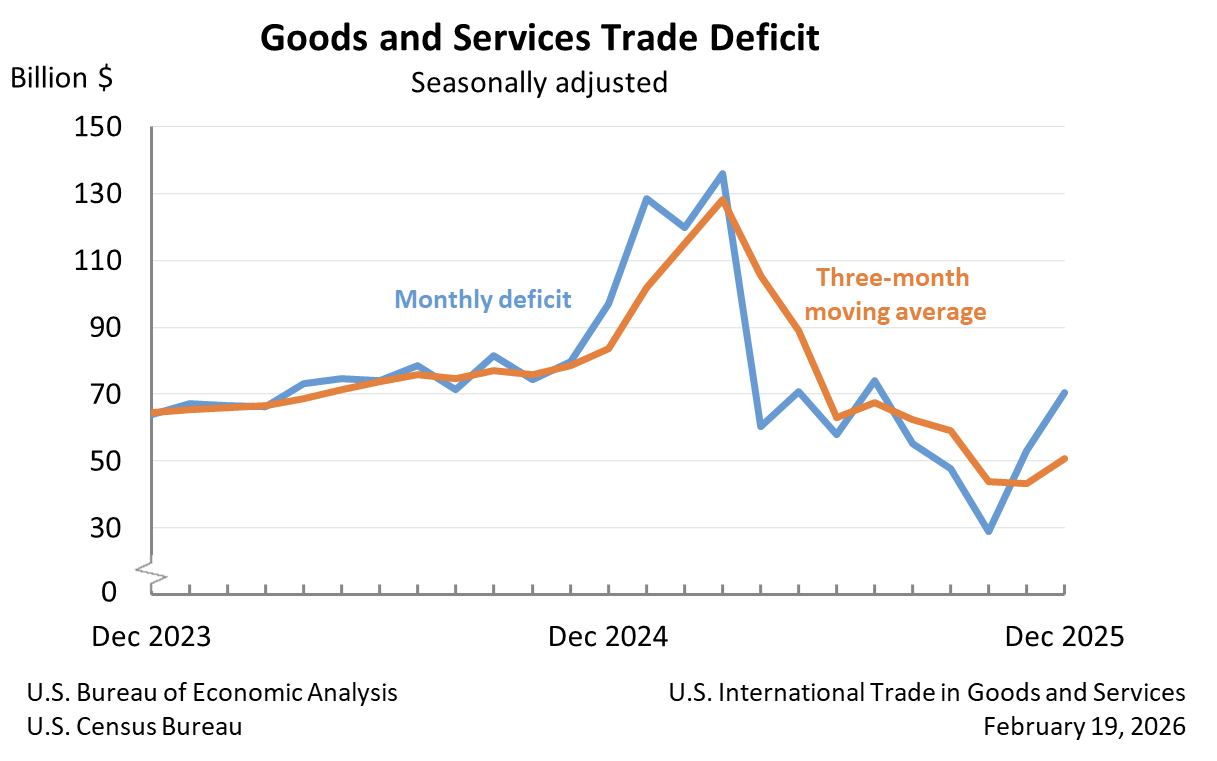
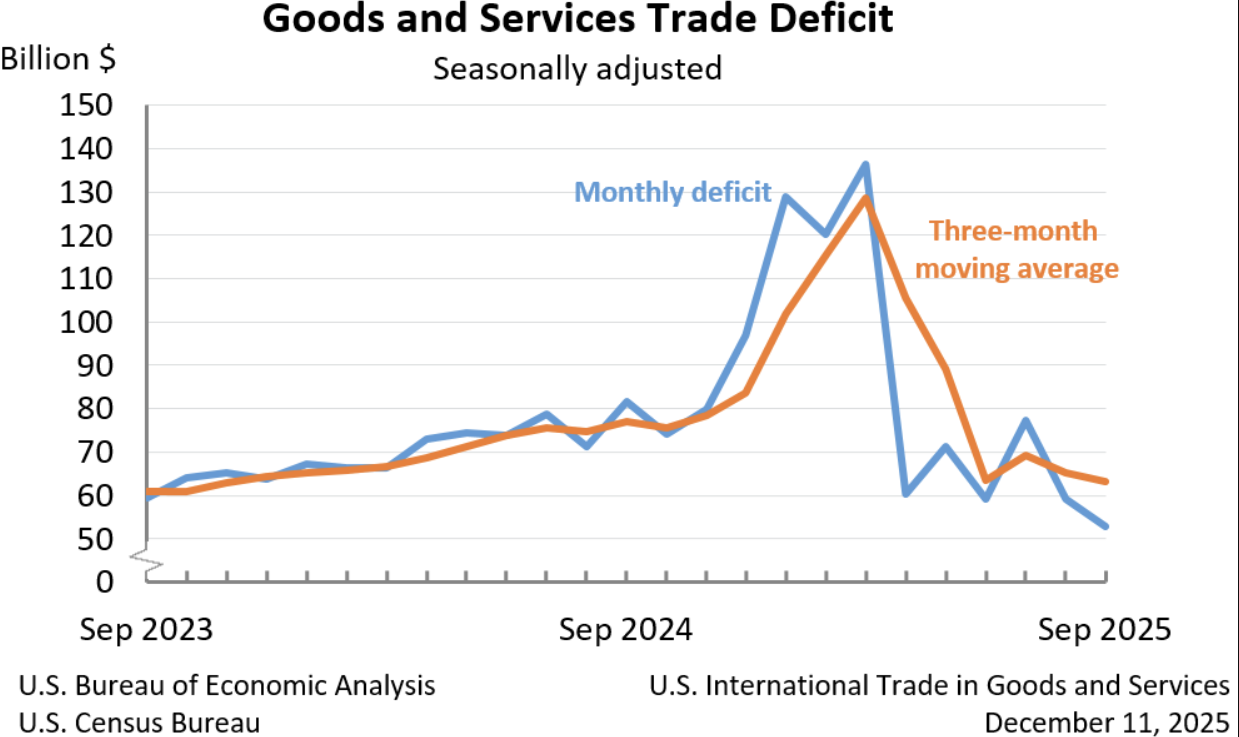
The goods and services deficit widened to $70.3 billion in December (+$17.3 billion MoM, +32.6% MoM), driven by lower exports and higher imports and signalling a monthly deterioration in the trade balance.
-
Exports fell to $287.3 billion in December (-$5.0 billion vs November), with goods exports down about $5.5 billion; industrial supplies and nonmonetary gold led declines, down $8.7 billion and $7.1 billion respectively. This pushed nominal export weakness in the month.
-
Imports rose to $357.6 billion in December (+$12.3 billion MoM), with goods imports up $10.2 billion. Notable gains included industrial supplies +$7.0 billion, capital goods +$5.6 billion, and computer accessories +$3.4 billion, indicating stronger import demand for intermediate and capital items.
-
The goods deficit expanded to $99.3 billion in December (+$15.7 billion MoM), while the services surplus narrowed to $29.0 billion (-$1.6 billion MoM), together accounting for the larger overall deficit.
-
On a real basis, the goods deficit rose $12.5 billion to $97.1 billion as real exports fell -$4.2 billion and real imports rose +$8.4 billion, showing the deterioration reflected volume changes as well as nominal flows.
-
Country breakdowns showed widening deficits with several partners, including Taiwan (deficit up $4.1 billion to $19.8 billion), while the surplus with Switzerland fell sharply by $8.0 billion to $0.1 billion, highlighting uneven bilateral shifts.
-
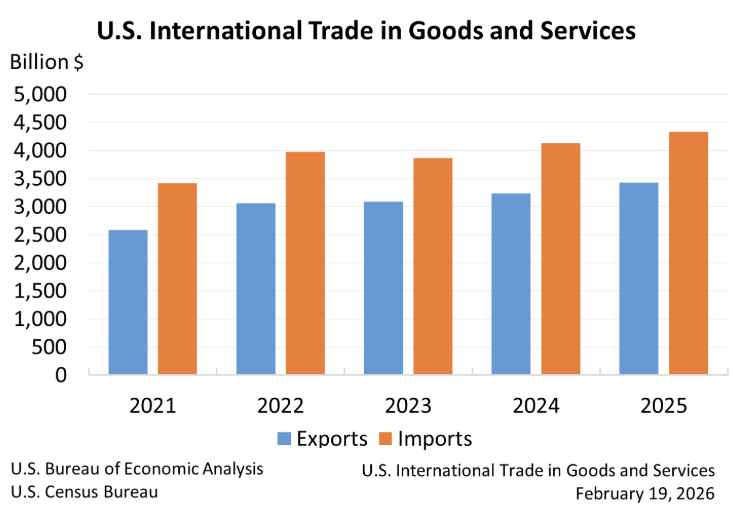
For the year 2025, the annual goods and services deficit was $901.5 billion, a small decline of $2.1 billion from 2024; annual exports rose $199.8 billion (+6.2%) and annual imports rose $197.8 billion (+4.8%), leaving a year-to-year balance that was broadly unchanged despite the monthly swing.
-
-
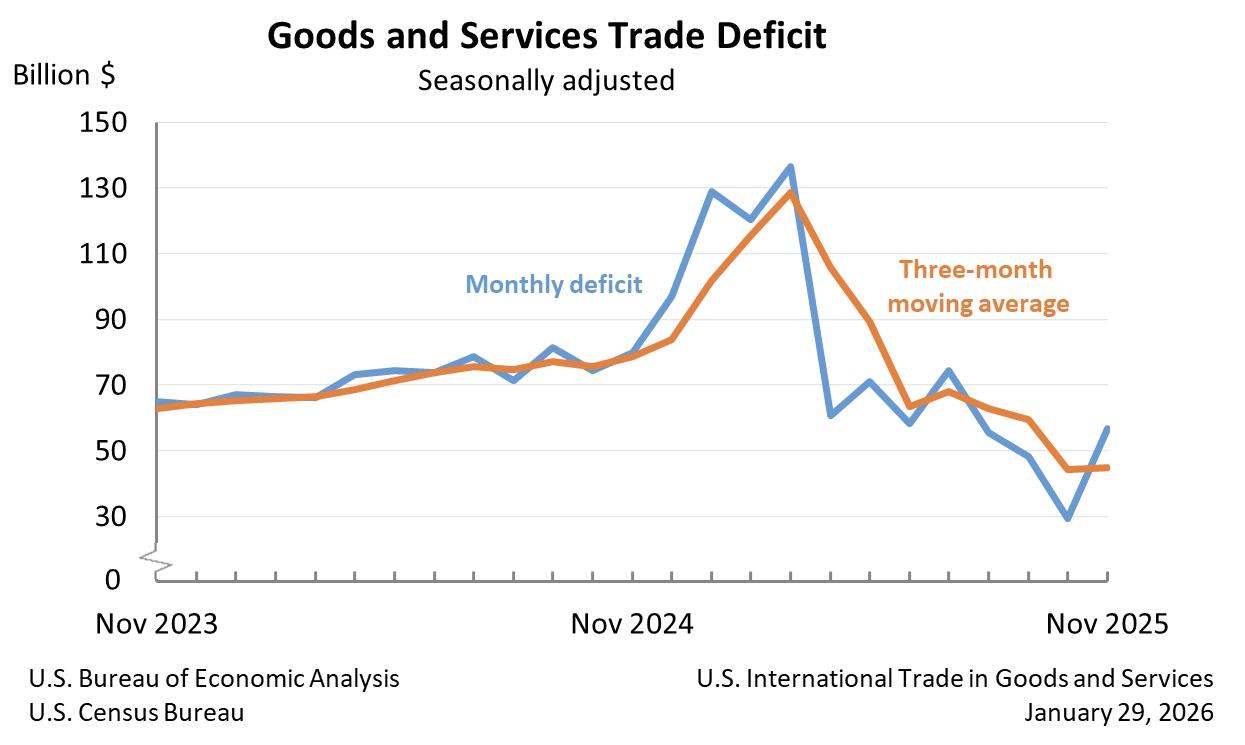
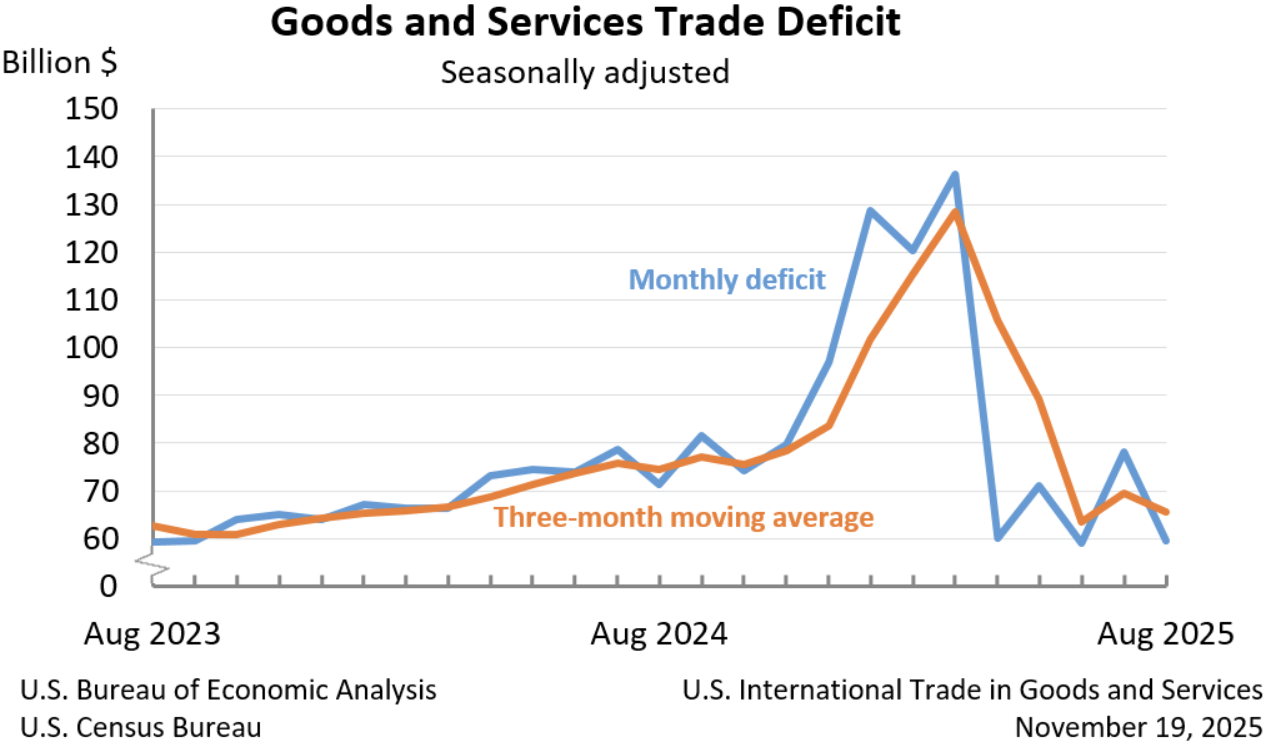
The U.S. goods and services trade deficit widened to $56.8B in November 2025 (+94.6% MoM; largest MoM move on record), reversing October’s sharp narrowing amid falling exports and rising imports.
-
Exports declined to $292.1B (-$10.9B MoM; -3.6% MoM), driven by an -$11.1B drop in goods exports led by industrial supplies (-$6.1B), nonmonetary gold (-$4.2B), and consumer goods (-$3.1B), while services exports edged up +$0.2B.
-
Imports increased to $348.9B (+$16.8B MoM; +5.0% MoM), with goods imports up +$16.8B led by consumer goods (+$9.2B), capital goods (+$7.4B), pharmaceuticals (+$6.7B), and computers (+$6.6B), while services imports dipped -$0.1B.
-
The goods deficit widened +$27.9B MoM to $86.9B, while the services surplus rose slightly +$0.3B to $30.1B, showing the deterioration was concentrated in merchandise trade.
-
Year-to-date, the total trade deficit rose +$32.9B (+4.1% YoY), as exports increased +6.3% YoY and imports increased +5.8% YoY, indicating faster import growth over 2025 overall.
-
The three-month average deficit edged up to $44.7B (+$0.4B), though it was -$33.8B lower YoY, with average exports up +$23.4B YoY and average imports down -$10.4B YoY.
-
On a real basis, the goods deficit expanded +$23.5B MoM (+36.9%) to $87.1B, as real exports fell -6.0% MoM and real imports rose +6.3% MoM, confirming a large volume-driven widening.
-
Bilaterally, deficits widened with the EU (+$8.2B to $14.5B) and Singapore (from +$1.8B to -$1.1B), while the surplus with Switzerland rose to $7.8B (+$0.6B), highlighting uneven partner-level shifts.
-
-
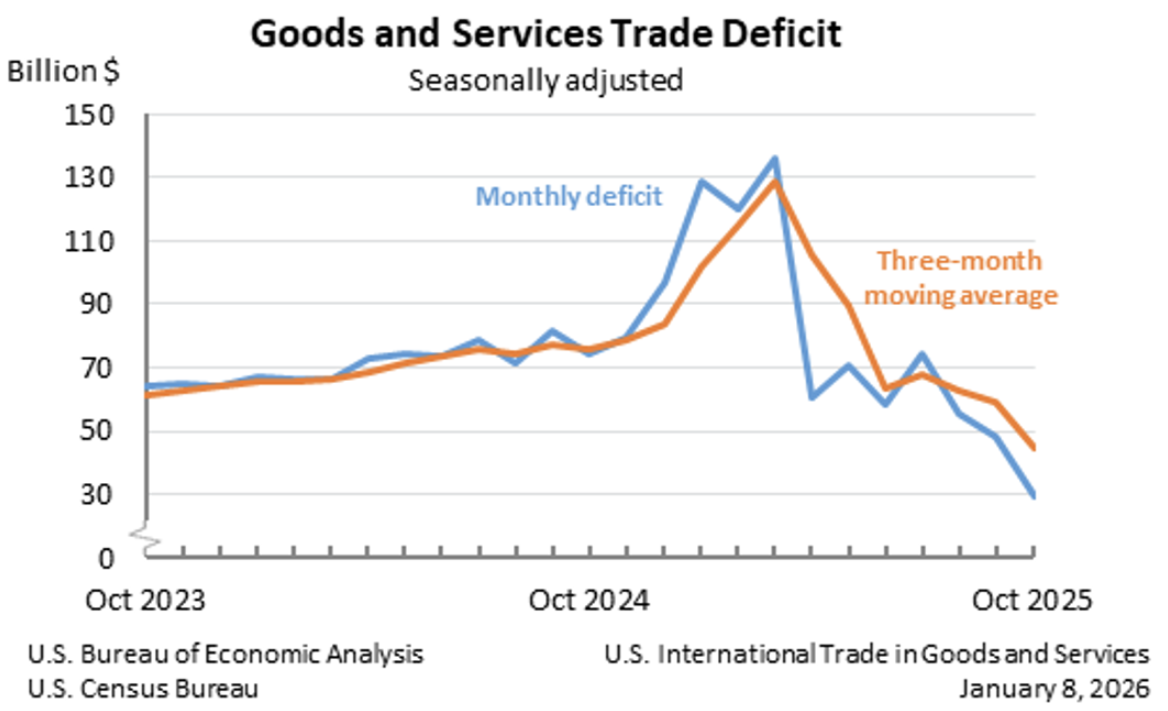
The U.S. goods and services trade deficit narrowed to $29.4B (vs $58.9 bil expected) in October (-39.0% MoM), the lowest since 2009 amid record exports and falling imports.
-
Exports rose to a record $302.0B (+$7.8B MoM; +2.6% MoM), driven by a $7.1B increase in goods exports to $195.9B and a $0.7B rise in services exports to a record $106.1B, indicating broad-based export strength.
-
Imports declined to $331.4B (-$11.0B MoM; -3.2% MoM), with goods imports falling $12.1B to $255.0B, led by sharp declines in consumer goods (-$14.0B) and pharmaceuticals (-$14.3B).
-
The goods deficit narrowed -$19.2B MoM to $59.1B, the lowest since March 2016, while the services surplus edged down -$0.4B to $29.8B, showing the improvement was concentrated in merchandise trade.
-
Year-to-date, the total trade deficit widened +$56.0B (+7.7% YoY), as imports (+6.6% YoY) continued to outpace exports (+6.3% YoY) despite October’s sharp monthly improvement.
-
The three-month average deficit fell to $44.4B (-$15.0B), with average exports up $6.0B and average imports down $9.0B, pointing to a sustained recent narrowing trend.
-
Real goods trade improved materially, with the real goods deficit shrinking -19.8% MoM to $63.1B; real exports rose +3.9% MoM while real imports fell -4.2% MoM, reinforcing the strength of volume-adjusted trade flows.
-
By partner, the deficit with Ireland narrowed sharply to $3.2B (-$15.1B MoM), while deficits widened with Taiwan (+$6.3B to $15.7B) and Mexico remained elevated at $17.9B, highlighting divergent bilateral trade dynamics.
-
-
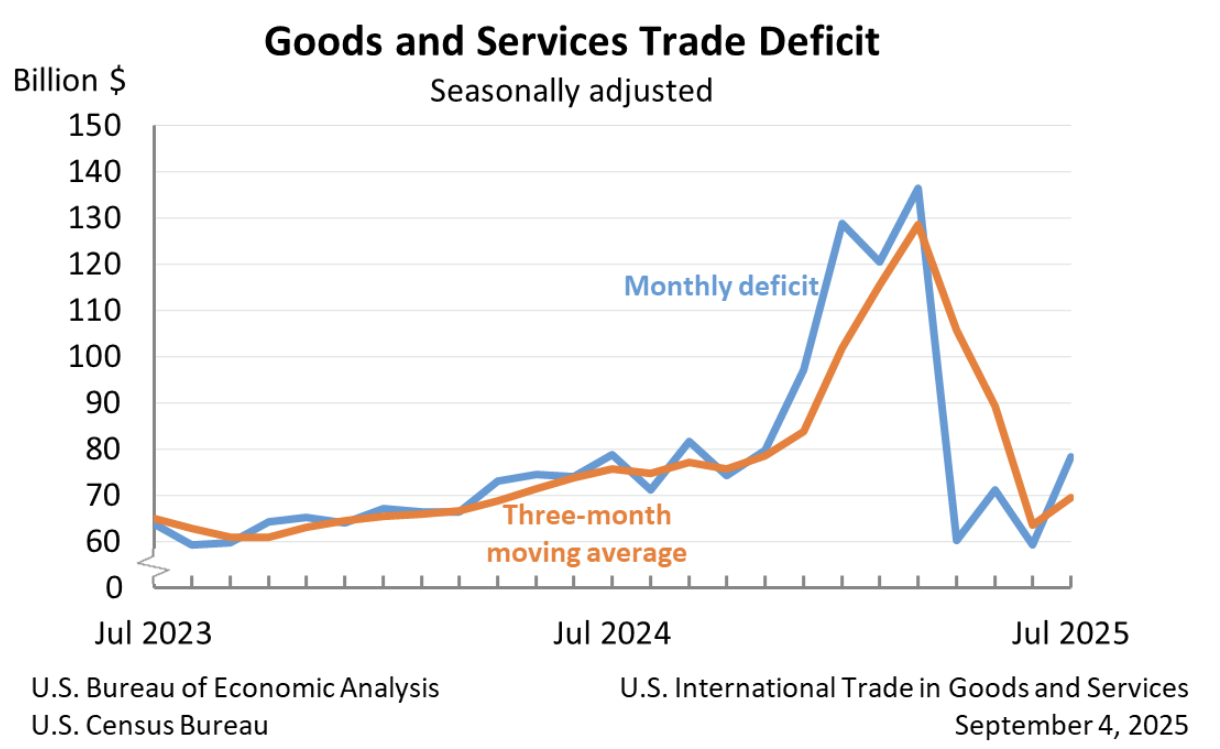
The U.S. trade deficit narrowed -10.9% MoM to $52.8 billion in September, the smallest since mid-2020, as exports rose sharply (+3.0% MoM) while imports increased only modestly (+0.6% MoM).
-
Exports rose to $289.3 billion (+$8.4B MoM), driven by an $8.8B increase in goods exports, with nonmonetary gold alone contributing +$6.1B, underscoring its outsized role in the monthly gain.
-
Imports increased to $342.1 billion (+$1.9B MoM), reflecting a small uptick in goods imports (+$1.7B), led by consumer goods (+$10.2B) and pharmaceuticals (+$12.9B), partly offset by declines in capital goods (-$5.6B) and computers (-$4.7B).
-
The goods deficit narrowed -$7.1B to $79.0B, while the services surplus decreased -$0.6B to $26.2B, showing improvement concentrated in merchandise trade.
-
Year-to-date, the total deficit widened +17.2% YoY (+$112.6B), as stronger import growth (+7.7% YoY) continued to outpace exports (+5.2% YoY), despite September’s improvement.
-
The three month average deficit fell to $63.1B (-$2.1B MoM), with average exports up +$3.2B and average imports up +$1.1B, indicating recent softening in import demand.
-
Real goods exports increased +4.2% MoM (+$6.2B), while real goods imports rose +0.7% MoM (+$1.5B), narrowing the real goods deficit by -5.6% MoM to $79.0B, a smaller improvement than the nominal decline.
-
Switzerland shifted from a small deficit to a $6.6B surplus, reflecting a $7.1B jump in exports, while the deficit with China narrowed -$4.0B to $11.4B as imports declined sharply (-$3.9B).
-
-
The U.S. trade deficit narrowed sharply in August 2025 to $59.6 billion, improving -23.8% MoM from July’s revised $78.2 billion, reflecting a large drop in imports that outweighed stable exports.
-
Exports rose +0.1% MoM to $280.8 billion, a modest $0.2 billion increase driven by higher services exports, signaling broadly steady outbound trade activity.
-
Imports fell -5.1% MoM to $340.4 billion, an $18.4 billion decline led by sharp drops in industrial supplies, nonmonetary gold, consumer goods, and capital goods.
-
The goods deficit shrank by -$18.1 billion to $85.6 billion, the smallest since September 2023, while the services surplus increased +$0.5 billion to a record $26.1 billion, both contributing to the overall deficit improvement.
-
Year-to-date, the trade deficit widened +25.0% YoY (+$142.5 billion), as imports (+9.2% YoY) continued to outpace exports (+5.1% YoY), showing that August’s improvement was counter to the broader annual trend.
-
The three-month average deficit decreased to $65.6 billion, as average exports were little changed while average imports fell $3.7 billion, indicating recent softening in import demand.
-
Goods exports slipped -$0.5 billion MoM, with declines in consumer goods (-$1.5 billion), pharmaceuticals (-$1.2 billion), and industrial supplies (-$0.6 billion) partly offset by gains in capital goods (+$2.4 billion) and computers (+$2.3 billion).
-
Goods imports plunged -$18.6 billion MoM, led by industrial supplies (-$11.3 billion), nonmonetary gold (-$9.3 billion), and consumer goods (-$3.7 billion), marking one of the broadest monthly declines across categories.
-
In real terms, the inflation-adjusted goods deficit narrowed -16.9% MoM to $83.7 billion, as real imports fell -7.2% while real exports dipped only -0.4%, highlighting a substantial improvement in real net trade.
-
-
The U.S. trade deficit widened to $78.3 billion in July 2025, up +32.5% MoM from June’s revised $59.1 billion, as imports rose much faster than exports.
-
Exports increased +0.3% MoM (+$0.8 billion) to $280.5 billion, led by gains in capital goods (+$0.6 billion), computer accessories (+$0.9 billion), and nonmonetary gold (+$2.9 billion), partly offset by declines in excavating machinery (-$1.5 billion) and finished metal shapes (-$2.5 billion).
-
Imports surged +5.9% MoM (+$20.0 billion) to $358.8 billion, driven by industrial supplies and materials (+$12.5 billion, including +$9.6 billion in nonmonetary gold), capital goods (+$4.7 billion), and consumer goods (+$1.3 billion). Automotive imports fell -$3.2 billion across vehicles, parts, and engines.
-
The goods deficit widened by +$18.2 billion to $103.9 billion, while the services surplus narrowed -$1.1 billion to $25.6 billion, reflecting weaker balance support from services.
-
In real (2017 dollar) terms, the goods deficit expanded +18.3% MoM to $100.1 billion, as real imports rose +6.6% while real exports slipped -0.2%.
-
Year-to-date, the overall trade deficit is up +30.9% YoY (+$154.3 billion), with exports higher by +5.5% and imports by +10.9%.
-
-
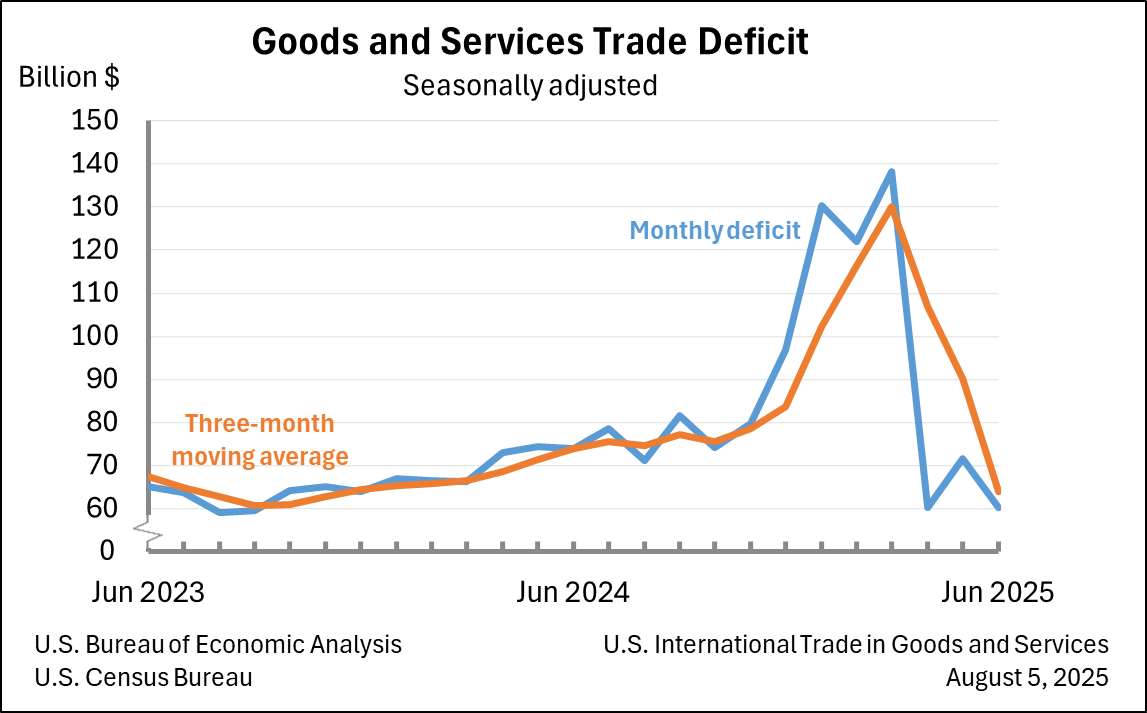
The U.S. trade deficit narrowed to $60.2 billion in June 2025 (from $71.7 billion in May), as imports fell -3.7% MoM while exports dipped -0.5% MoM.
- Goods exports declined -$1.2 billion to $179.1 billion, driven by a -$4.8 billion drop in industrial supplies and materials; capital goods rose +$2.0 billion to a record $59.4 billion.
- Goods imports fell -$12.6 billion to $265.0 billion, with sharp declines in consumer goods (-$8.4 billion), pharma (-$9.6 billion), and industrial supplies (-$2.7 billion).
- On a real (2017 dollar) basis, the goods deficit shrank -$8.7 billion to $84.6 billion, with real imports down -4.5% and real exports down -1.5%.
- The U.S. posted record trade deficits with Vietnam (-$16.5 billion) and Taiwan (-$12.6 billion); the deficit with China fell to $9.5 billion, the lowest since Feb 2004.
- Year-to-date, the overall trade deficit has risen +38.3% YoY to $161.5 billion; exports are up +5.2%, imports up +12.1%.
-
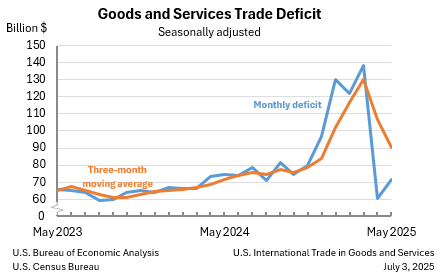
The U.S. trade deficit widened to $71.5 billion in May 2025 (from $60.3 billion in April), as exports fell sharply while imports were little changed.
- Exports declined -4.0% MoM to $279.0 billion, led by a -$10.0 billion drop in industrial supplies and -$1.9 billion in capital goods; services exports also dipped slightly.
- Imports edged down -0.1% MoM to $350.5 billion, with declines in consumer goods (-$4.0 billion) and industrial supplies (-$0.9 billion) offset by increases in autos (+$3.4 billion) and computers (+$4.4 billion).
- The goods deficit rose to $97.5 billion (+$11.2 billion), while the services surplus was steady at $26.0 billion.
- On a real (2017 dollar) basis, the goods deficit rose +9.6% MoM to $92.5 billion as real exports fell -5.3% and real imports were nearly flat.
- The trade deficit with China narrowed to $14.0 billion (lowest since Mar 2020), while deficits with Mexico (+$17.1 billion), Vietnam (+$14.9 billion), and Taiwan (+$11.5 billion) hit record highs.
-
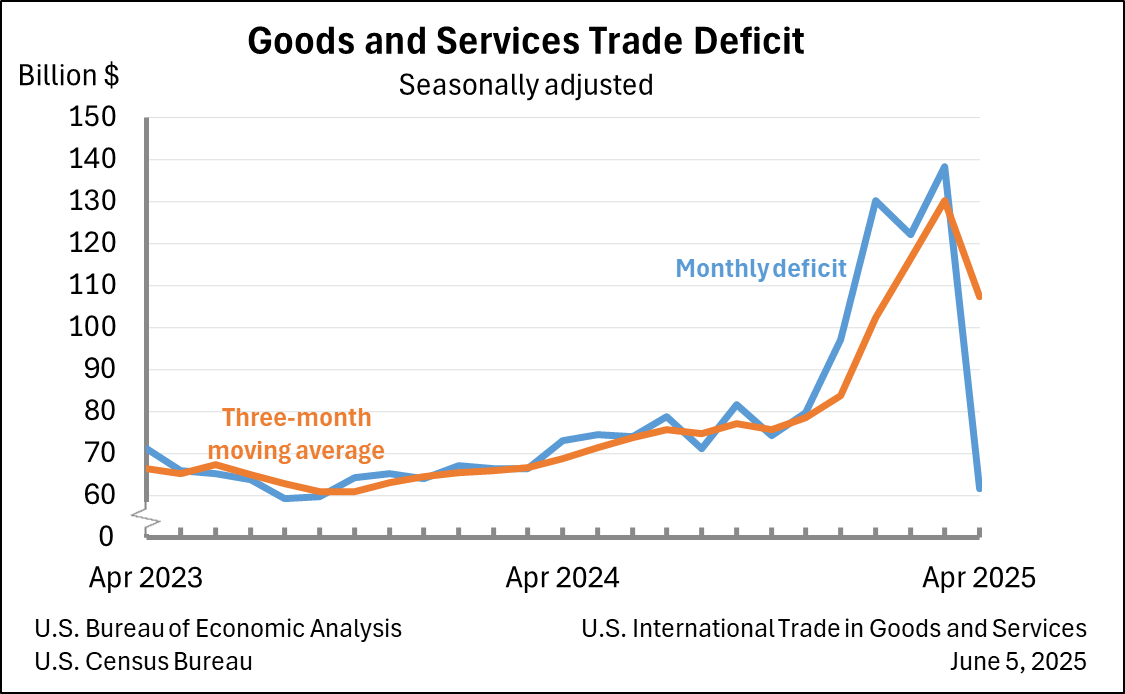
The U.S. trade deficit narrowed sharply to $61.6 billion in April 2025, down -55.5% MoM from $138.3 billion in March, as imports plunged and exports rebounded.
- Exports rose +3.0% MoM to $289.4 billion, led by industrial supplies (+$10.4B), nonmonetary gold (+$4.2B), and financial/travel services (+$2.1B combined).
- Imports fell -16.3% MoM to $351.0 billion, driven by steep declines in consumer goods (-$33.0B), pharmaceuticals (-$26.0B), and industrial supplies (-$23.3B).
- The goods deficit fell -$75.2 billion to $87.4 billion, while the services surplus rose +$1.5 billion to $25.8 billion.
- Real goods deficit fell -42.9% MoM to $85.6 billion; real goods imports dropped -19.9% and exports rose +3.1%.
- Largest trade deficits were with China (-$19.7B), EU (-$17.9B), and Vietnam (-$14.5B); Switzerland shifted to a +$3.5B surplus from a -$15.4B deficit in March.
-
The trade deficit reached another record high in March as the surge in imports continued into the end of the first quarter. At the same time, export growth was slower and offered no offset to the large increase in incoming goods. This widening gap in trade reflects not only the front-loading of goods ahead of new tariffs, but also growing uncertainty around global trade relations, particularly with key partners in Europe and Asia, as firms brace for potential disruptions.
Trade Deficit
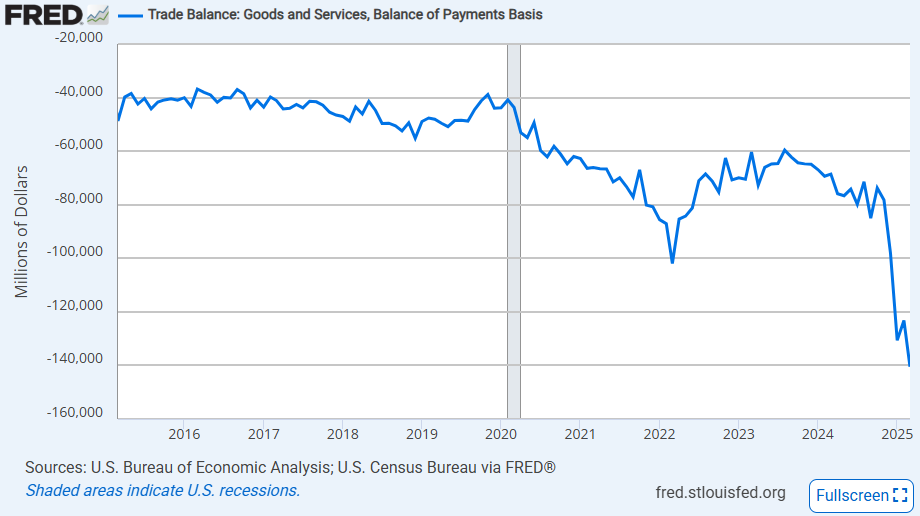
The BEA reported the March 2025 trade deficit at $140.5 billion in March, an increase of 14.0% MoM and the largest monthly deficit on record. This included an increase of 11.2% MoM in the goods trade deficit which reached $163.5 billion, slightly above the estimate from the Census Bureau’s advance economic indicators report of $162.0 billion (and that advance estimate was well above the $146.0 billion consensus forecast). The surge in the deficit in the beginning of Q1 was largely expected as the tariffs on China, Canada, and Mexico were announced in February, but the March surge has been a bit of a surprise and was a major factor in Q1 GDP surprising to the downside.
Imports
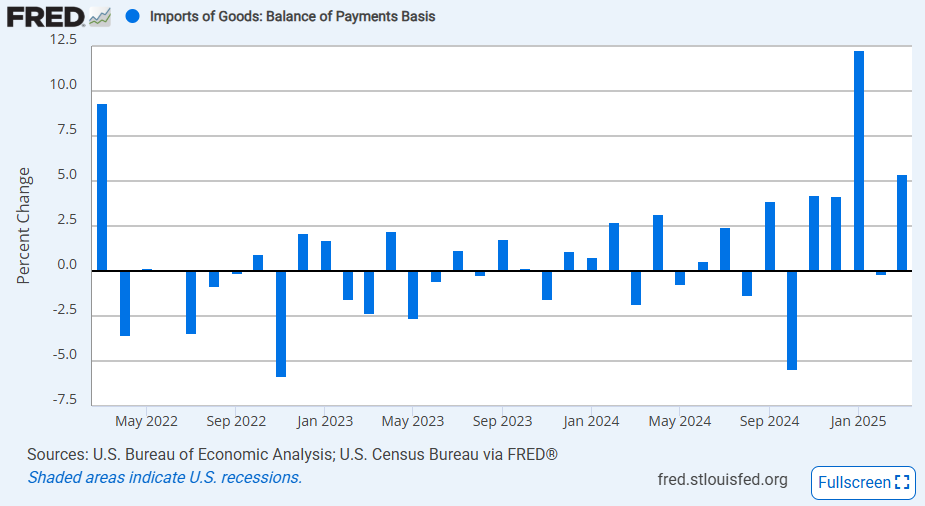
The deficit reached another record high due to another sizeable increase in imports in March. The 4.4% MoM increase in total imports was another strong gain after the surge of around 10% in January. Goods imports alone saw a stronger increase of 5.4% MoM and that led to many records: most capital goods imports ever at $93.1 billion, most consumer goods imports ever at $103.2 billion, and, more generally, most non-petroleum imports ever at $326.6 billion.
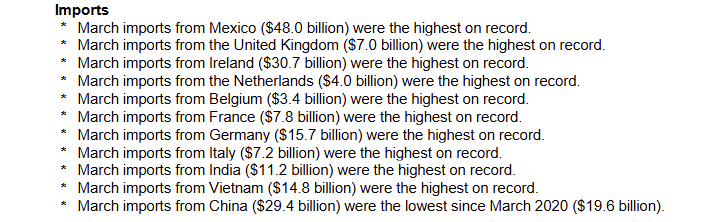
This surge was likely more fueled by the expectations of the broader reciprocal tariffs that were announced in early April. Thus, we see that imports surged to record highs for a number of the largest European economies: the UK, Ireland, the Netherlands, Belgium, France, Germany, and Italy. There were also record-high imports from India and Vietnam, two countries that typically benefit from US-China trade tensions that were hit with “Liberation Day” tariffs. Because the harshest tariffs that were in place were against China, there was a notable drop in imports from China in March, totaling $29.4 billion, the lowest since March 2020.
Exports
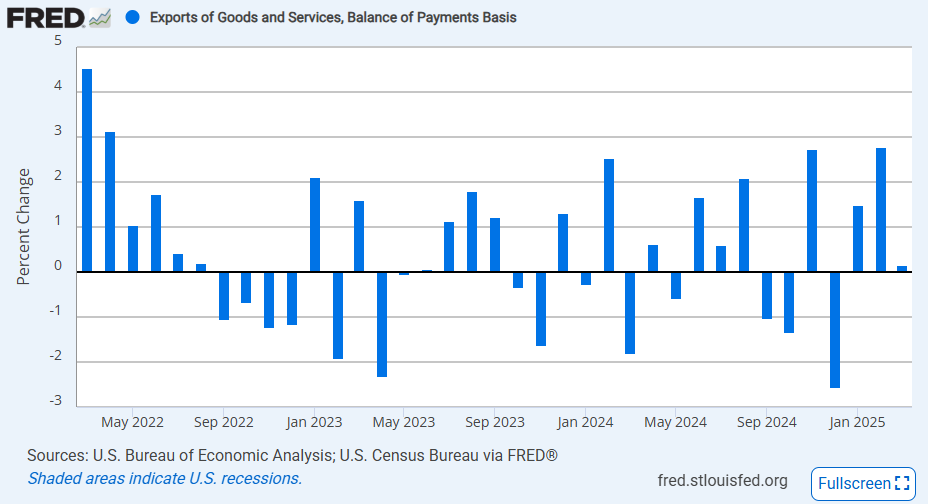
Another factor that played into the surge in the deficit was a rather limp increase in exports in March. In the last month of Q1, US exports abroad increased just 0.2% MoM, with goods exports up just 0.7% MoM. While the increase was small, the total value of exports in March was still strong because of the jump of 4.8% MoM in February. Thus, we still have that March goods exports were the highest since July 2022, and non-petroleum exports were the highest on record. In fact, energy prices falling in March likely played a part in lowering the total value of petroleum exports and impacting the deficit.
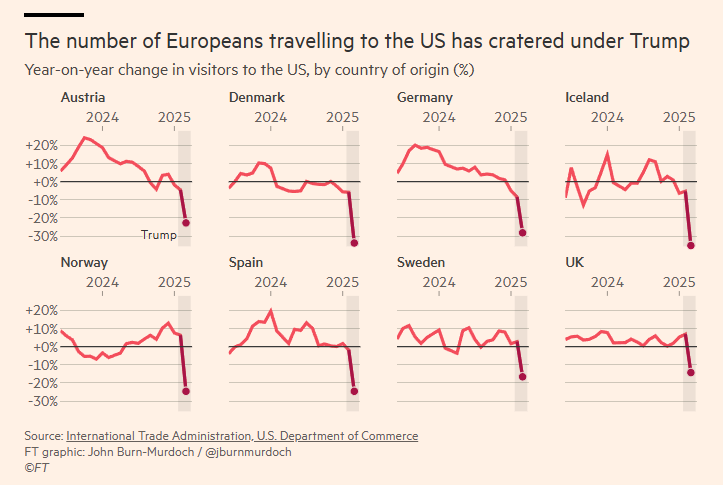
Another data point that has started to creep into the trade discourse is the US exports of travel services. The Financial Times has highlighted a significant decline in the number of Europeans travelling to the US, and that actually factors into the deficit calculation. In March specifically, there was a -7.1% MoM drop in travel services exports to just below $17 billion which is the lowest since November 2023. In the broader trade picture, the -$1.3 billion drop played only a minor role in increasing the deficit, but it does outline a new trend that is arising from weakness in US tourism.
Based on the totality of the report, it appears that the surprise in trade data likely came from an unexpected front-loading of imports from the EU, and in general, an increase in several of the deficits with EU economies. This suggests that firms are highly uncertain about the outcome of an EU-US trade deal, especially one that involves very low or no tariffs. The front-running is similar to what we saw in response to the China and North America tariffs, even though those trade restrictions were harsher.
Additionally, we might be seeing the start of a decoupling of US and EU business relations as evidenced by the decline in travel services and the weaker increase in US exports to the EU compared to the large increase in the flow of goods in the reverse direction. The two entities are set to enter trade negotiations, but the EU has started with a threat of tariffs on €100 billion of US goods if the talks fail.