US Industrial Production
About
-
August 18th, 2026 · 9:15 AM
-
September 16th, 2026 · 9:15 AM
-
October 16th, 2026 · 9:15 AM
-
November 17th, 2026 · 9:15 AM
-
December 16th, 2026 · 9:15 AM
Latest Releases
12
Industrial production rose +0.7% MoM (vs +0.4% MoM expected) and +2.3% YoY in January after +0.2% MoM (revised down from +0.4% MoM) in December, showing stronger start-of-year output growth.
-
Manufacturing output increased +0.6% MoM (largest since Feb 2025), with durable goods +0.8% and nondurables +0.4%, indicating broad-based factory gains including the first rise in motor vehicles and parts since Aug 2025.
-
Mining output fell -0.2% MoM after -0.9% MoM in December, while utilities rose +2.1% MoM, showing strength concentrated outside the extraction sector.
-
Consumer goods output rose +0.7% MoM and business equipment +0.9% MoM, with gains across all equipment categories, pointing to widespread improvement across demand segments.
-
Materials output increased +0.6% MoM and nonindustrial supplies +0.9% MoM, reflecting positive contributions from business and construction supplies.
-
Capacity utilization rose to 76.2% (+0.4 ppt for manufacturing to 75.6%), remaining -3.2 ppts below the long-run average, indicating continued slack despite stronger production.
-
Mining utilization edged down to 84.4% and utilities rose to 72.9%, both still below long-run averages, suggesting operating rates remain subdued across sectors.
-
Industrial capacity is projected to rise +1.1% in 2026 (2025: +1.5%), with manufacturing capacity +1.0% and utilities +2.8%, pointing to moderate expansion in productive capacity.

Industrial production rose +0.4% MoM (vs 0.1% MoM expected) in December and was up +2.0% YoY, reflecting broad-based gains to end the year.
- Manufacturing output rose +0.2% MoM (vs -0.2% MoM expected) in December but declined at a -0.7% annual rate in Q4, showing a positive month offset by weaker quarterly momentum.
- The November changes in industrial and manufacturing production were both revised up, to +0.4% MoM (vs +0.2% MoM previously) and +0.3% MoM (vs 0.0% MoM previously), respectively.
- Mining output fell -0.7% MoM in December but remained +1.7% YoY, indicating a soft month while still higher than a year earlier.
- Utilities output climbed +2.6% MoM in December, supported by a +12.0% increase in natural gas output, pointing to a utilities-driven boost in overall production.
- Consumer goods output increased +0.7% MoM, as nondurables rose +1.1% while durables fell -0.7%, highlighting strength in nondurables alongside continued durables softness.
- Business equipment output rose +0.8% MoM, supported by increases in transit equipment and industrial/other equipment, signaling improved equipment production at year-end.
- Within manufacturing, durable output edged up +0.1% MoM (primary metals +2.4%, electrical equipment +1.7%, aerospace & misc transport +1.5%), while wood products, nonmetallic minerals, and motor vehicles/parts declined by at least -1%.
- Capacity utilization rose to 76.3% in December (manufacturing 75.6% unchanged; mining 85.7% down; utilities 72.3% up), remaining -3.2 ppts below the long-run average overall.


Industrial production rose +0.2% MoM in November after a -0.1% MoM decline in October, while output was +2.5% YoY, pointing to modest late-year gains amid uneven sector performance.
-
Total IP averaged +0.1% MoM across October and November, matching September’s pace but running slower than the average increase over the past 12 months.
-
Manufacturing output was flat MoM in November after a -0.4% MoM drop in October; manufacturing production was still +1.9% YoY, indicating mild annual growth despite recent softness.
-
Consumer goods output increased +0.3% MoM in November, with nondurable goods rising while consumer durables continued to decline, led by ongoing weakness in automotive products.
-
Business equipment output rebounded +0.3% MoM in November after a -0.3% decline in October, with information processing equipment rising in both months.
-
Mining output fell -0.8% MoM in October but rose +1.7% MoM in November, leaving the sector higher on net over the two-month period.
-
Utilities output increased +2.6% MoM in October before slipping -0.4% MoM in November, producing a small net gain but continued volatility.
-
Capacity utilization edged up to 76.0% in November, remaining 3.5 ppts below its long-run average; manufacturing utilization held at 75.4%, while mining stayed above its historical norm and utilities remained well below theirs.

Industrial production increased 0.1% MoM in September after -0.3% MoM in August (revised down from -0.1% MoM initial estimate), while output was 1.6% YoY higher, marking modest late-quarter momentum with mixed sector performance.

-
Manufacturing output was flat MoM but rose 1.5% YoY; durable goods edged up 0.1% MoM while nondurables slipped -0.1% MoM, showing little net movement across factory categories.
-
Utilities output increased 1.1% MoM, driven by a 1.3% rise in electric utilities that outweighed a -0.4% decline in natural gas utilities; overall utility output still contracted at a -2.3% annualized rate in Q3.
-
Mining production was unchanged MoM but expanded at a 2.9% annualized rate in Q3, leaving the sector as one of the steadier contributors to quarterly gains.
-
Consumer goods output fell -0.6% MoM, with durable consumer goods down -1.7% MoM and automotive products down -2.9% MoM; nondurable consumer goods declined -0.3% MoM across both energy and non-energy categories.
-
Business equipment production rose 0.7% MoM and increased at a 5.9% annualized rate in Q3, marking a third straight quarterly rise and broad strength across all major equipment categories.
-
Materials output increased 0.4% MoM, supported by gains in equipment parts and energy materials that outweighed declines in consumer parts, other durable materials, and nondurable materials.
-
Capacity utilization held at 75.9% overall (3.6 ppts below its long-run average); manufacturing utilization dipped to 75.5%, while mining remained above its long-run average at 85.4% and utilities rose to 69.9% but stayed well below long-run norms.

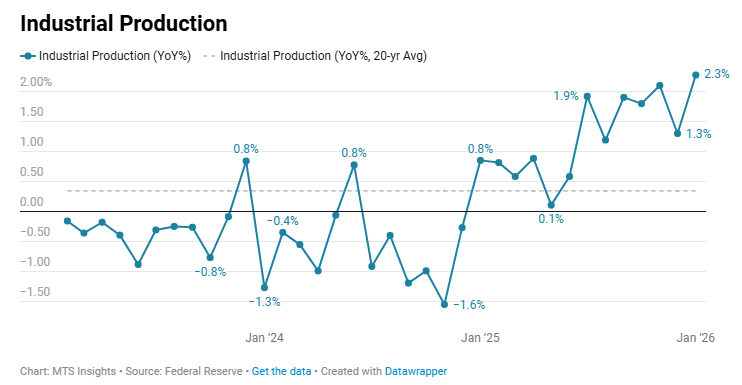
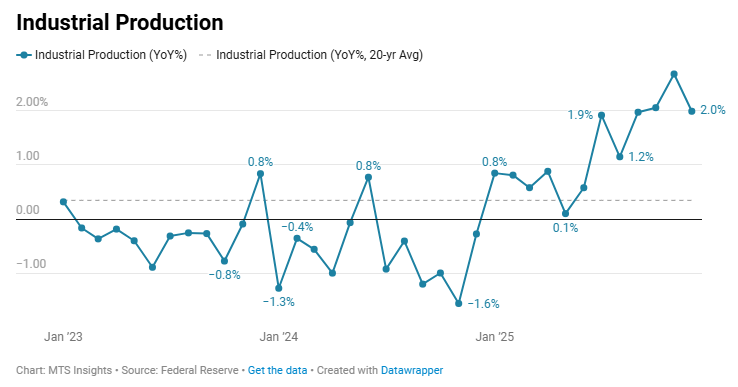
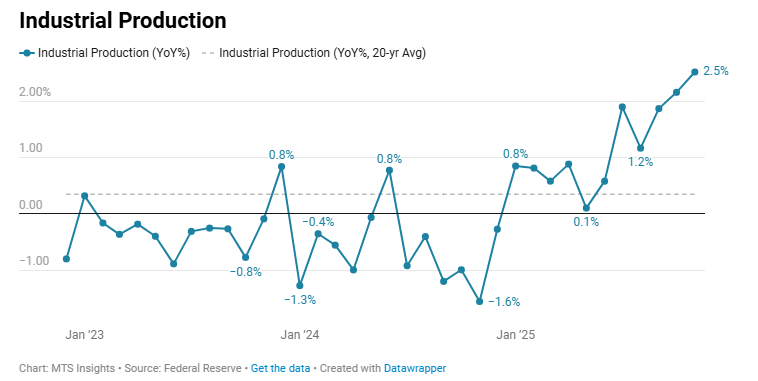
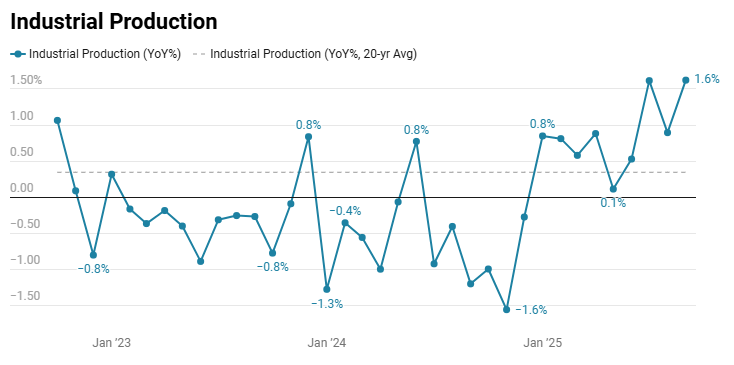
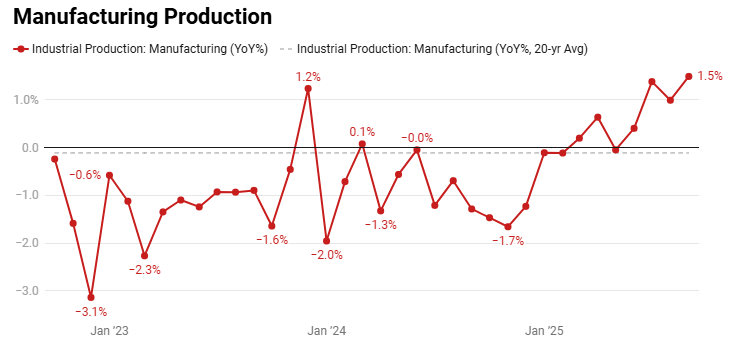
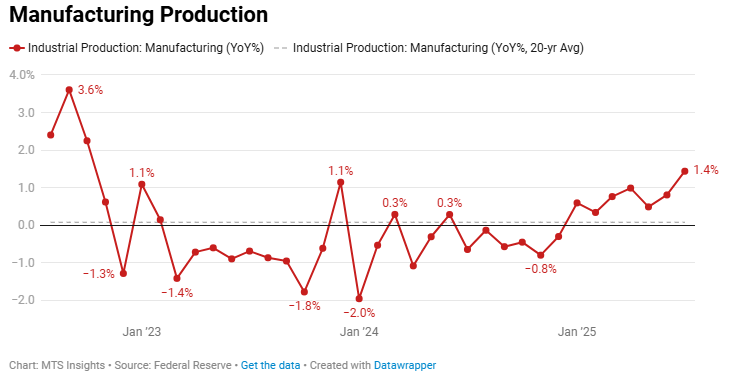
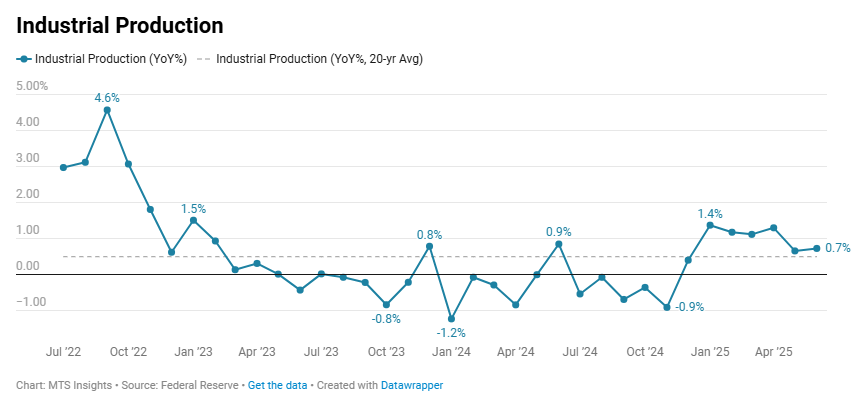
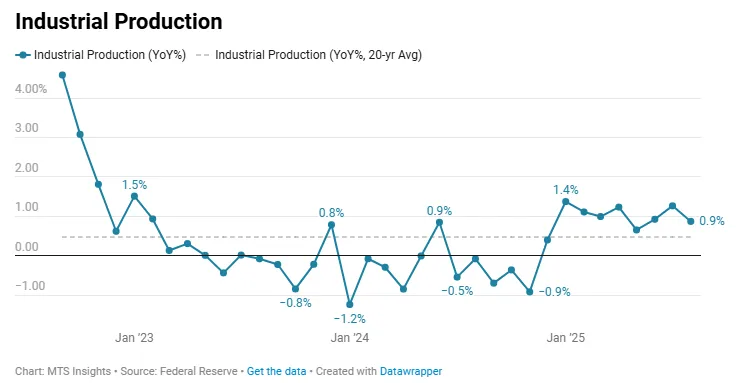
Industrial production increased just 0.1% MoM in August, ahead of the expectations of a -0.1% MoM drop, and the monthly drop in July was revised down from -0.1% MoM in the first estimate to a larger -0.4% MoM drop in the revised estimate. The acceleration in industrial activity seen at the beginning of this year continues to stall at the end of the summer. The annual increase in overall production slowed to 0.9% YoY after picking up to 1.3% YoY previously. Similarly, manufacturing production annual growth slowed from 1.3% YoY in July, which was the strongest increase since October 2022, to 0.9% YoY.
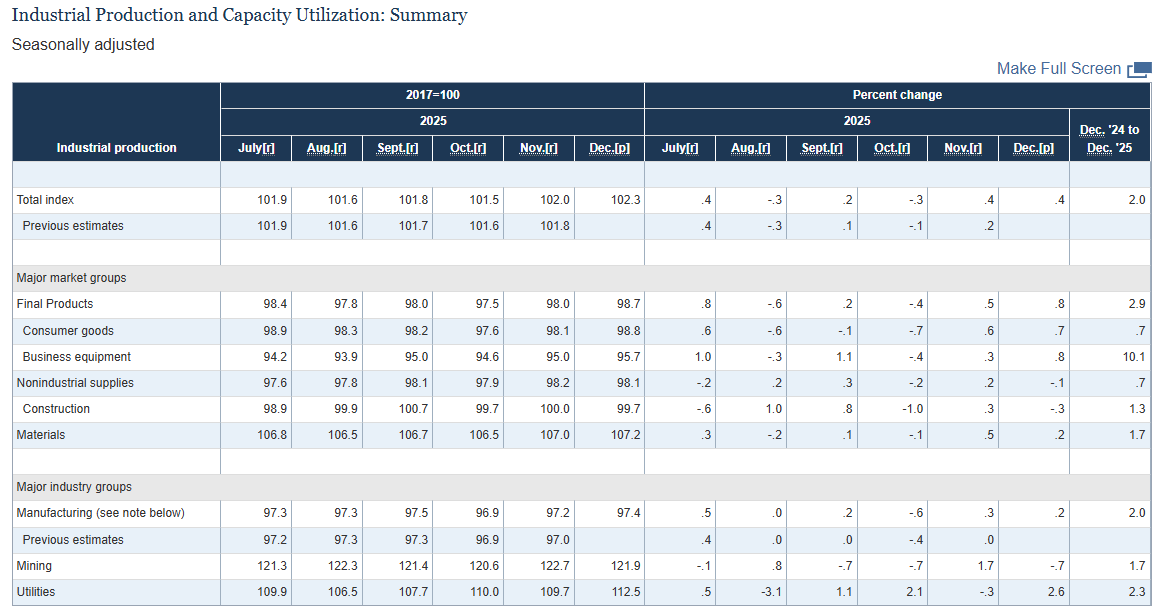
Despite the slight headline beat, the details of August’s industrial production report pointed to underlying softness. Capacity utilization remained stuck at 77.4%, well below its long-run average, while business equipment output slipped (-0.1% MoM) as declines in industrial equipment offset gains elsewhere. Within manufacturing, most of the modest 0.2% MoM increase was carried by a 2.6% MoM jump in motor vehicles and parts, with other factory output essentially flat and key categories like fabricated metals, machinery, and plastics posting declines. When excluding auto production, industrial production was flat, and durable goods production was down -0.2% MoM. Utilities were also a drag, with output falling -2.0% MoM as electric utilities contracted, underscoring the mixed performance across industrial sectors.
US industrial production declined -0.1% MoM in July, the first monthly drop since March. The latest report also revised down May and June numbers such that the former saw no growth (revised down from 0.1% MoM) and the latter saw a smaller 0.3% MoM increase (revised down from 0.4% MoM). Manufacturing production was flat in July, slightly avoiding the decline of -0.1% MoM that was expected. Despite there only being a slight increase on a monthly basis, the annual increase in manufacturing production reached 1.4%, the strongest since October 2022.
The strong annual gain is supported by several key industries seeing their own strong YoY growth: computer & electronics (+5.6% YoY), motor vehicles & parts (+8.3% YoY), and aerospace & other transport equipment (+8.9% YoY). These segments have helped to drive durable goods manufacturing up 2.7% YoY. However, they are weighed down by nondurable manufacturing, which declined -0.4% MoM and is only up 0.6% YoY in July. In fact, last month, there was not a single segment that saw an increase in nondurable manufacturing production. This includes petroleum & coal products, which fell -0.5% MoM and is only up 0.7% MoM.
US industrial production rose 0.3% MoM and 0.7% YoY in June, rebounding from flat readings in April and May. For Q2 overall, production grew at a 1.1% annualized rate.
- Manufacturing output was up just 0.1% MoM, while mining declined -0.3% and utilities surged 2.8%.
- Durable goods output was flat in June, with autos down -2.6% MoM and electrical equipment down -2.5%, offset by gains in primary metals (+3.1%) and aerospace (+1.6%).
- Nondurable production rose 0.3% MoM, led by a 2.9% increase in petroleum and coal products.
- Consumer goods output rose 0.2% MoM, but autos pulled durable production down -1.4%, while energy nondurables jumped 2.7%.
- Capacity utilization increased to 77.6% overall; manufacturing rose to 76.9%, utilities to 70.1%, and mining fell to 90.6%.
- Total industrial production was 0.7% above June 2024 levels, with Q2 mining output up 5.7% annualized despite the June dip.
