
US Industrial Production: September 2025 (DELAYED)
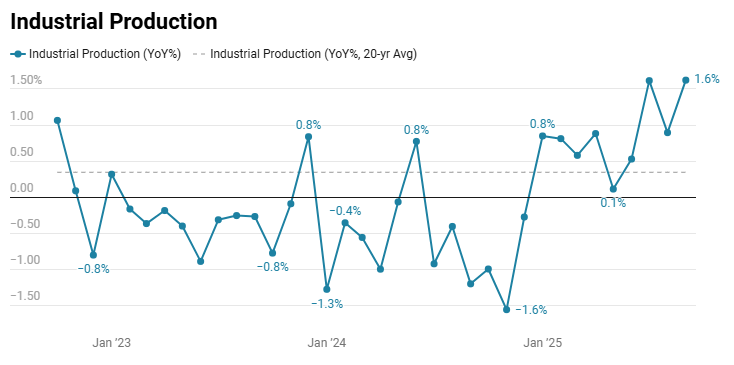
Industrial production increased 0.1% MoM in September after -0.3% MoM in August (revised down from -0.1% MoM initial estimate), while output was 1.6% YoY higher, marking modest late-quarter momentum with mixed sector performance.
-
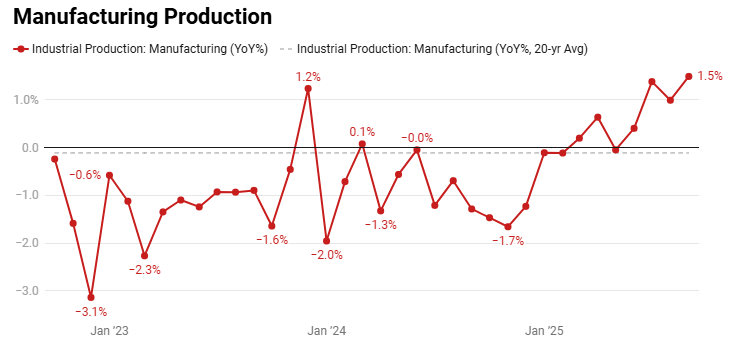
Manufacturing output was flat MoM but rose 1.5% YoY; durable goods edged up 0.1% MoM while nondurables slipped -0.1% MoM, showing little net movement across factory categories.
-
Utilities output increased 1.1% MoM, driven by a 1.3% rise in electric utilities that outweighed a -0.4% decline in natural gas utilities; overall utility output still contracted at a -2.3% annualized rate in Q3.
-
Mining production was unchanged MoM but expanded at a 2.9% annualized rate in Q3, leaving the sector as one of the steadier contributors to quarterly gains.
-
Consumer goods output fell -0.6% MoM, with durable consumer goods down -1.7% MoM and automotive products down -2.9% MoM; nondurable consumer goods declined -0.3% MoM across both energy and non-energy categories.
-
Business equipment production rose 0.7% MoM and increased at a 5.9% annualized rate in Q3, marking a third straight quarterly rise and broad strength across all major equipment categories.
-
Materials output increased 0.4% MoM, supported by gains in equipment parts and energy materials that outweighed declines in consumer parts, other durable materials, and nondurable materials.
-
Capacity utilization held at 75.9% overall (3.6 ppts below its long-run average); manufacturing utilization dipped to 75.5%, while mining remained above its long-run average at 85.4% and utilities rose to 69.9% but stayed well below long-run norms.