
 Logistics Managers’ Index
- Source
- Logistics Managers’ Index
- Source Link
- https://www.the-lmi.com/
- Frequency
-
Monthly
1st Tuesday of every month
- Next Release(s)
- May 5th, 2026 6:00 AM
-
June 2nd, 2026 6:00 AM
-
July 7th, 2026 6:00 AM
-
August 4th, 2026 6:00 AM
-
September 1st, 2026 6:00 AM
-
October 6th, 2026 6:00 AM
-
November 3rd, 2026 6:00 AM
-
December 1st, 2026 6:00 AM
Latest Updates
-
Logistics Managers’ Index: March 2026

-
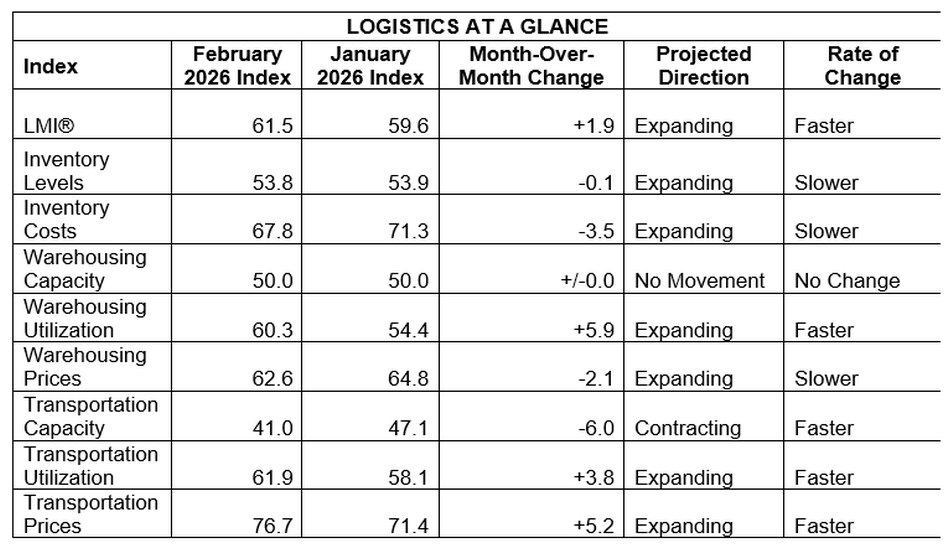
The Logistics Manager’s Index rose to 61.5 in February (+1.9 pts MoM from 59.6), marking the fastest expansion since February 2025 and signaling accelerating logistics activity led by transportation tightening and higher freight prices.
-
Transportation Capacity contracted to 41.0 (-6.0 pts MoM), the fastest rate of contraction since November 2021, indicating significantly tighter freight availability, particularly among larger firms reporting 32.6.
-
Transportation Prices surged to 76.7 (+5.2 pts MoM), the highest since March 2022, while Transportation Utilization increased to 61.9 (+3.8 pts), showing the strongest freight market conditions in roughly four years.
-
Inventory Levels expanded marginally at 53.8 (-0.1 pts MoM), reflecting a lean inventory strategy, with large firms reporting contraction at 44.6 versus robust expansion of 60.0 among smaller firms.
-
Inventory Costs eased to 67.8 (-3.5 pts MoM from 71.3), marking slower cost growth but remaining elevated, with larger firms experiencing faster expansion at 74.3 compared to 63.0 for smaller firms.
-
Warehousing Capacity held steady at 50.0 (+/-0.0 pts), indicating no movement for a second straight month, while Warehousing Utilization rose to 60.3 (+5.9 pts) and Warehousing Prices remained elevated at 62.6 (-2.1 pts), consistent with higher asset usage despite stable capacity.
-
Forward expectations for the overall index increased slightly to 66.3 (+0.5 pts), with respondents projecting strong growth in Transportation Prices (80.9), Transportation Utilization (73.6), and Warehousing Prices (69.9), suggesting expectations of continued freight market strength over the next 12 months.
-
-
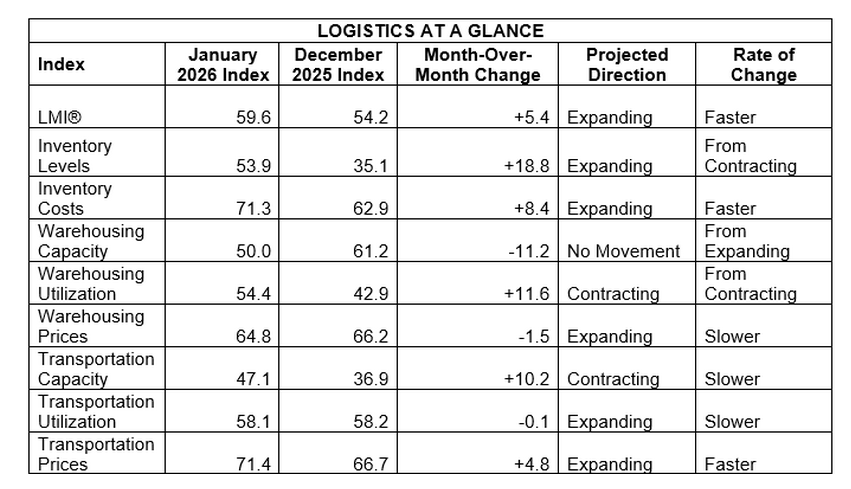
The Logistics Manager’s Index rose to 59.6 in January 2026 (+5.2 pts MoM) but was -2.4 pts lower YoY, reflecting a rebound from December’s low as firms began mild restocking.
-
The headline LMI increased to 59.6 (Dec: 54.2, +5.2 pts MoM), the fastest expansion since May but the 11th straight reading below the all time average (61.3), pointing to steady but slightly below trend logistics growth.
-
Inventory Levels swung to 53.9 (Dec: 35.1, +18.8 pts), rebounding from the lowest ever December reading and signaling restocking that the report characterizes as unusually mild for January.
-
Inventory Costs jumped to 71.3 (Dec: 62.9, +8.4 pts) and moved back above the 70 threshold for the 12th time in 13 months, indicating costs rose much faster than physical inventory volumes.
-
Warehousing Capacity dropped to 50.0 (Dec: 61.2, -11.2 pts) and was described as no movement, while Warehousing Utilization rose to 54.4 (Dec: 42.9, +11.6 pts), consistent with warehousing tightening as inventory flows resumed.
-
Transportation Capacity remained in contraction at 47.1 (Dec: 36.9, +10.2 pts), showing constraints eased versus December but did not fully return to neutral, with larger firms reporting tighter capacity than smaller firms.
-
Transportation Prices increased to 71.4 (Dec: 66.6, +4.8 pts), the strongest expansion since April 2022, aligning with continued capacity tightness and higher freight demand.
-
Forward expectations held elevated, with the 12 month outlook for the overall index at 65.8 (Dec: 65.3, +0.5 pts) and respondents projecting significant cost growth across Inventory Costs (74.2), Warehousing Prices (74.5), and Transportation Prices (79.5), suggesting continued logistics inflation pressure in the year ahead.
-
-
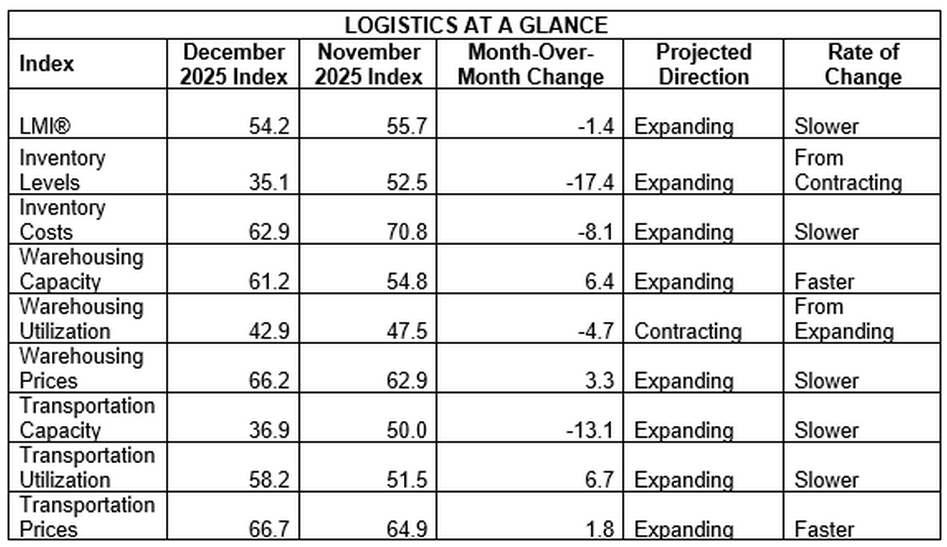
The December Logistics Manager’s Index eased to 54.2 (from 55.7 in November), marking the slowest expansion since April 2024 amid an extreme inventory drawdown and softer warehousing conditions.
-
The headline LMI fell -1.5 pts MoM to 54.2, remaining in expansion but logging its tenth consecutive reading below the long-run average of 61.4, with most of the drag coming from inventory and warehousing components.
-
Inventory Levels collapsed to 35.1 (from 52.5, -17.4 pts), the largest MoM decline in the history of the index, indicating an unprecedented drawdown as firms pushed goods downstream to meet strong holiday demand.
-
Inventory Costs slowed but stayed firmly expansionary at 62.9 (from 71.0, -8.1 pts), showing that carrying and handling costs continued to rise even as physical inventory volumes fell sharply.
-
Warehousing Utilization dropped to a second consecutive all-time low at 42.9 (from 47.6, -4.7 pts), while Warehousing Capacity rose to 61.2 (from 54.8, +6.4 pts), pointing to looser space conditions amid destocking.
-
Warehousing Prices continued to increase at a strong pace, rising to 66.2 (+3.3 pts), remaining the only LMI component that has never contracted since the index’s inception.
-
Transportation Capacity moved back into contraction at 36.9 (from 50.0, -13.1 pts), its lowest level since October 2021, signaling a sharp tightening in available freight capacity during peak holiday activity.
-
Transportation Utilization expanded to 58.2 (+6.7 pts) and Transportation Prices climbed to 66.7 (+1.8 pts), the fastest price expansion since January, reflecting strong seasonal freight demand despite lower diesel prices.
-
Forward-looking expectations rose, with respondents projecting the overall LMI at 65.3 in 12 months, alongside moderate inventory rebuilding but persistently high inventory, warehousing, and transportation costs in 2026.
-
-
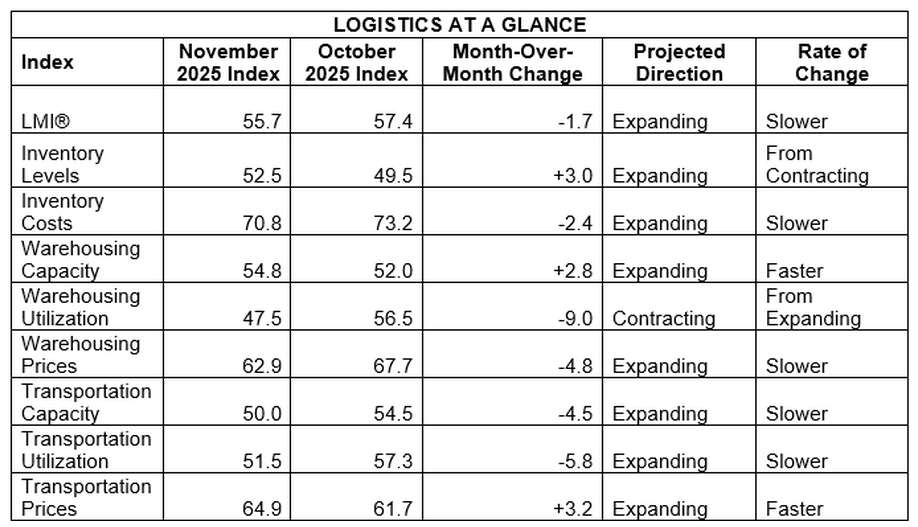
The November Logistics Manager’s Index came in at 55.7 (down -1.7 pts from 57.4 in October), indicating logistics activity is still expanding but at its slowest pace since mid-2024 as warehousing and transportation utilization cooled.
-
Inventory Levels rose to 52.5 in November (from 49.5), shifting back into mild expansion and suggesting stocks are being rebuilt, particularly at retailers, after contracting in October.
-
Inventory Costs eased to 70.8 (from 73.2, -2.4 pts) but remained firmly expansionary, and the report notes that every month of 2025 has seen significantly rising inventory costs, underscoring persistent pressure from tariffs and carrying expenses.
-
Warehousing Capacity increased to 54.8 (from 52.0, +2.8 pts), while Warehousing Utilization fell sharply to 47.5 (from 56.5, -9.0 pts), the first contraction in the index’s history, pointing to looser space conditions as inventories are drawn down and shifted downstream.
-
Warehousing Prices slowed but stayed elevated at 62.9 (down -4.8 pts from 67.7), and the report highlights that warehousing prices have never contracted and have averaged 69.2 in 2025, reflecting structurally high storage costs.
-
Transportation Capacity dropped to 50.0 (from 54.5, -4.5 pts), indicating no net change after three months of easing, while Transportation Utilization decelerated to 51.5 (from 57.3, -5.8 pts), showing only marginal growth in freight activity by month-end.
-
Transportation Prices accelerated to 64.9 (from 61.7, +3.2 pts), the fastest expansion since February; downstream retailers and larger firms reported especially strong price growth, consistent with peak-season retail movements and tighter effective freight capacity.
-
Looking ahead 12 months, respondents expect the overall LMI to rise to 62.9, with Inventory Levels forecast at 56.7 and Inventory Costs, Warehousing Prices, and Transportation Prices all projected above 70, implying expectations for leaner but more expensive inventories and tighter transportation conditions in 2026.
-
-
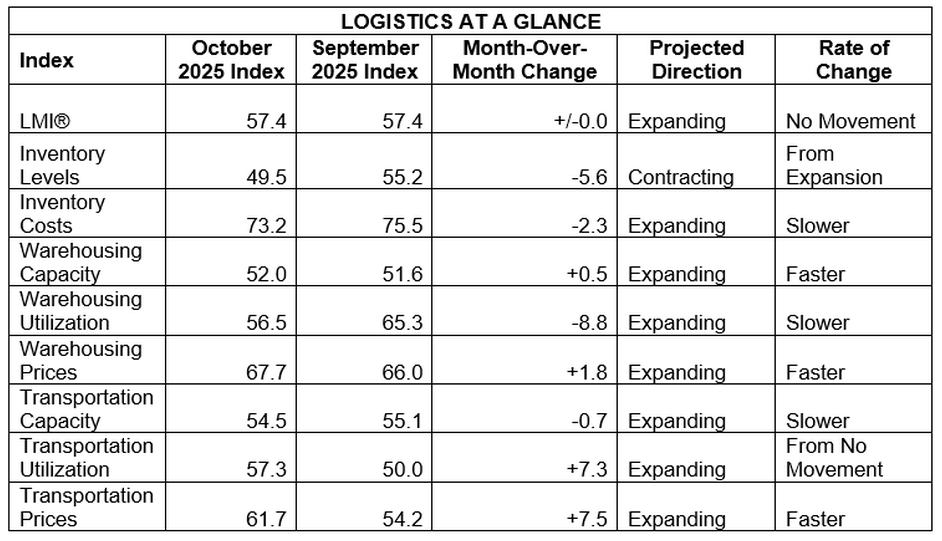
The Logistics Managers’ Index held steady at 57.4 in October 2025 (unchanged MoM), reflecting offsetting trends of easing inventory and warehousing activity balanced by a sharp rebound in transportation.
-
Inventory Levels fell -5.6 pts to 49.5, entering contraction as goods move downstream for holiday sales.
-
Inventory Costs decreased -2.3 pts to 73.2, still signaling strong upward cost pressure despite lower volumes.
-
Warehousing Capacity rose +0.5 pts to 52.0, a slight loosening consistent with reduced storage demand.
-
Warehousing Utilization dropped -8.8 pts to 56.5, indicating slower growth in warehouse usage.
-
Warehousing Prices increased +1.8 pts to 67.7, suggesting pricing remains firm despite marginally softer utilization.
-
Transportation Capacity slipped -0.7 pts to 54.5, showing slower expansion.
-
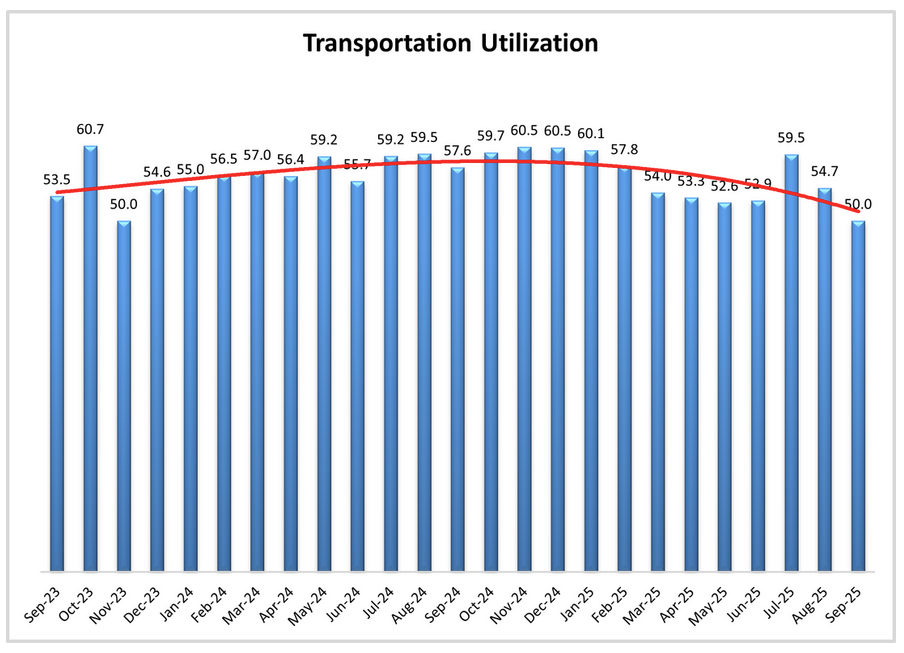
Transportation Utilization jumped +7.3 pts to 57.3, reflecting a surge in freight movement late in the month.
-
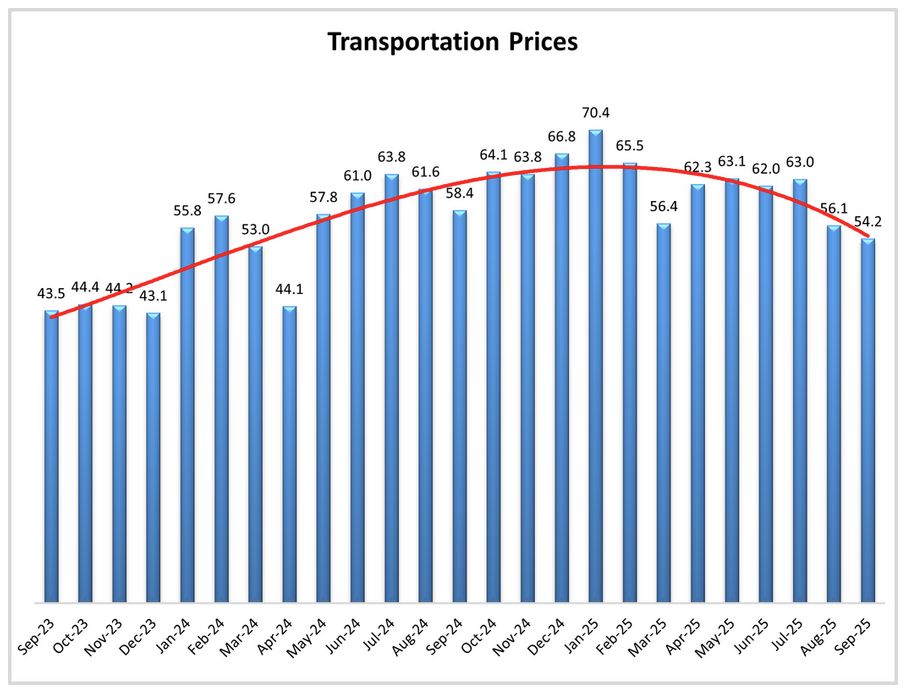
Transportation Prices rose +7.5 pts to 61.7, ending the two-month negative freight inversion as demand picked up.
-
Downstream retailers led the rebound, with Transportation Prices at 70.0 versus 56.4 upstream, as consumer demand drove seasonal freight flows.
-
The LMI remained below its long-run average (61.4) for the eighth consecutive month, though late-October readings showed stronger expansion at 60.3.
-
Researchers noted this pattern mirrors 2018’s seasonal dynamics, when downstream freight held steady despite upstream weakness tied to tariffs.
-
The report suggests inventories are finally being drawn down, easing warehousing tightness and reviving transportation activity, bringing logistics flows back to a more “dynamic, seasonally consistent” pattern.
-
Respondents expect the overall LMI to rise to 64.6 over the next year, anticipating leaner inventories but stronger price growth across costs, warehousing, and transportation.
-
-
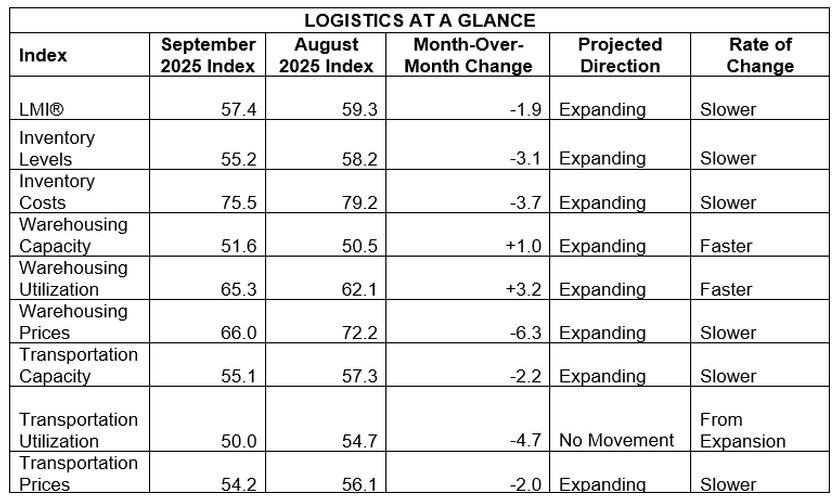
The Logistics Managers’ Index (LMI) fell -1.9 pts to 57.4 in September 2025, the lowest since March, signaling continued but slowing logistics expansion amid softer demand and a weakening freight market.
-
Transportation Utilization: Dropped -4.7 pts to 50.0, indicating no movement and marking the weakest September reading in the index’s history (avg. 65.1). Analysts note this unusual stagnation points to broad freight softness during what is typically peak season.
-
Transportation Prices & Capacity: Prices declined -1.9 pts to 54.2, slightly below Capacity (-2.2 to 55.1), extending the negative freight inversion for a second month. Upstream firms reported only marginal price growth (51.4) while Downstream firms saw stronger gains (61.1), showing a split between manufacturing and retail conditions.
-
Inventory Levels & Costs: Inventory Levels eased -3.1 pts to 55.2, while Costs remained high at 75.5 (-3.7). Downstream firms reported higher costs (79.2) than Upstream (73.3), suggesting retailers are bearing more of the price pressure.
-
Warehousing: Prices saw the largest drop of any component (-6.3 to 66.0) but remained above 2024 averages, while Capacity edged up +1.1 pts to 51.6 and Utilization rose +3.2 to 65.3, signaling tight but expanding warehouse use.
-
Downstream activity remains stronger, helping offset upstream stagnation in manufacturing and wholesale sectors burdened by earlier inventory builds.
-
U.S. manufacturing PMI rose slightly to 49.1 but stayed in contraction for a seventh month, with new orders at 48.9 and inventories at 47.7, reinforcing weak freight and production trends.
-
ADP estimated U.S. employment fell -32k in September, driven by small business losses, while imports from China fell -27% YoY for three straight weeks — further evidence of subdued supply chain throughput.
-
Respondents expect the overall LMI to rise slightly to 59.6 over the next 12 months, but with softer expectations for logistics costs and a leaner inventory approach, especially among downstream retailers.
-
-
The Logistics Managers’ Index (LMI) rose to 59.3 in August 2025 (+0.1 MoM; +2.8 YoY), indicating moderate expansion with mixed sub-components and a mild negative freight inversion.
-
Inventory Levels: 58.2 (+2.7 pts MoM) indicating a broad-based stock build, with Upstream 58.1 and Downstream 57.1 converging as inventories move toward retail.
-
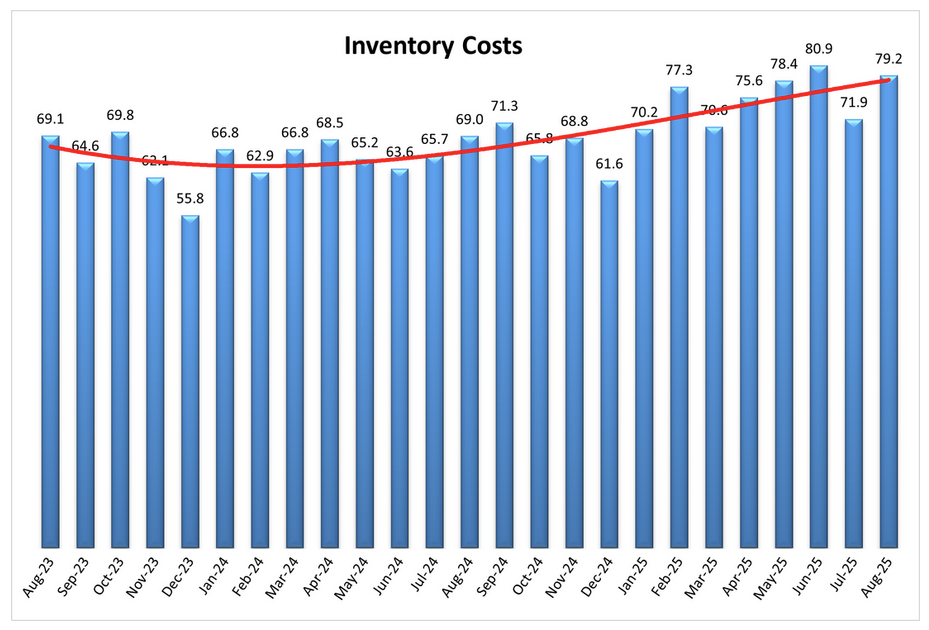
Inventory Costs: 79.2 (+7.3) rising near two-year highs; both small (83.7) and large firms (72.2) report strong cost expansion, implying pressure on margins.
-
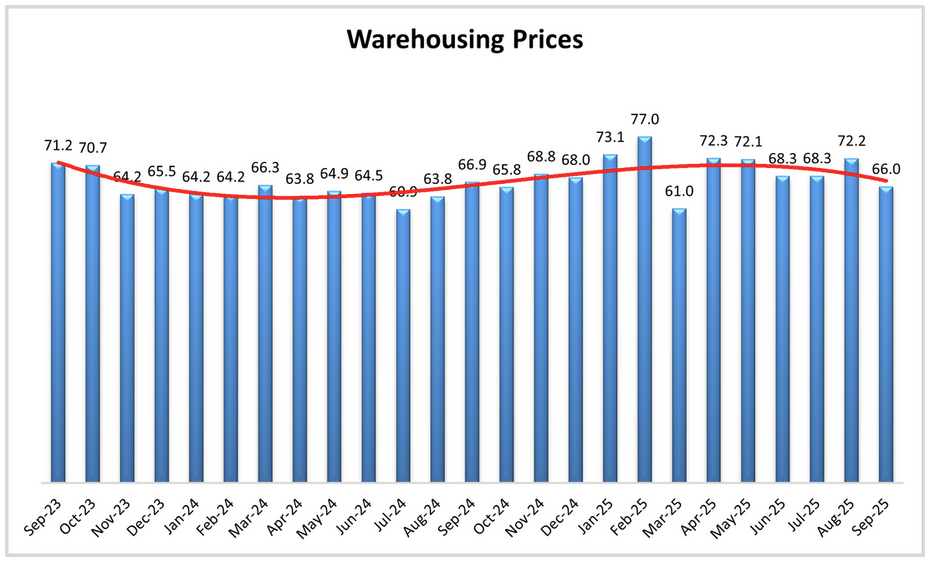
Warehousing: Capacity 50.5 (-0.6) and Utilization 62.1 (+2.6), Prices 72.2 (+3.9) pointing to tighter storage conditions, especially later in the month when capacity dipped into mild contraction (~49.1).
-
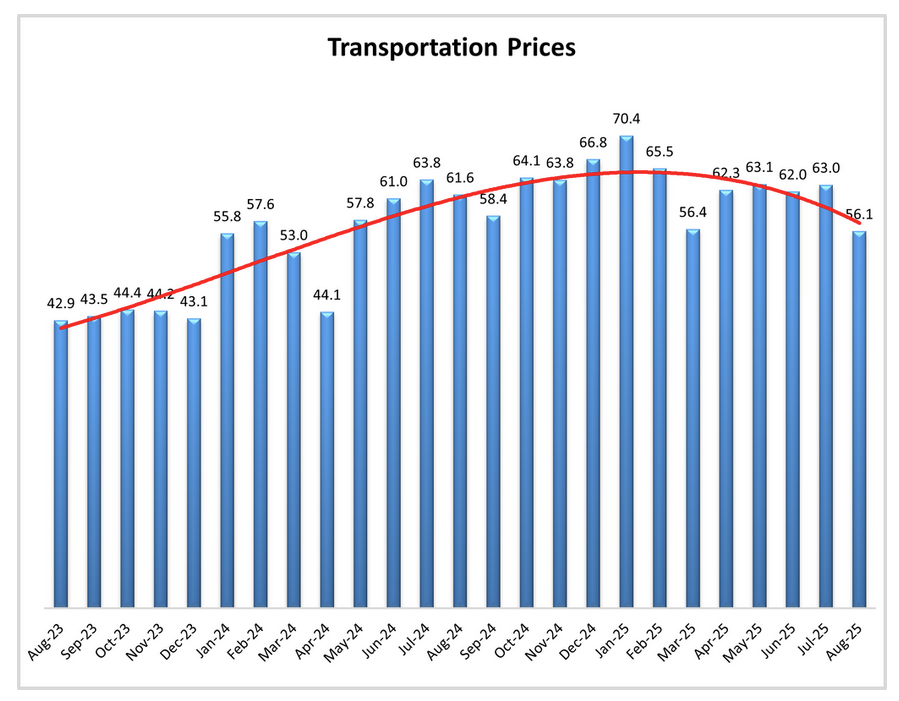
Transportation: Prices 56.1 (-6.9) and Utilization 54.7 (-4.8) while Capacity 57.3 (+4.7). Capacity now expanding faster than Prices (≈1.2-pt gap), signaling a slight negative freight inversion and softer upstream pricing (Upstream 51.5 vs Downstream 66.1).
-
Firm size split: Overall index higher for smaller firms at 62.7 vs 58.2 for larger firms, driven by higher inventory costs and tighter storage for small firms.
-
Timing effects: Early-month Transportation Utilization ~61.5 fell to ~50.0 late in August; Warehousing Capacity shifted from mild expansion (~52.8) to mild contraction (~49.1), indicating late-month slack in freight but tighter storage.
-
August reading is just below the long-run LMI average (61.5), pointing to steady, but not overheated, logistics activity.
-
-
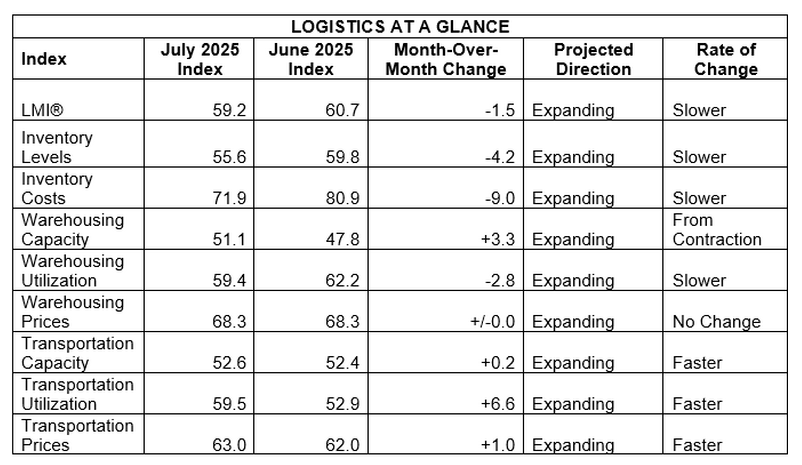
The Logistics Managers’ Index (LMI) slipped to 59.2 in July, down -1.5 pts from June and marking the fourth straight month of slowing expansion, driven by easing Inventory Costs and Inventory Levels.
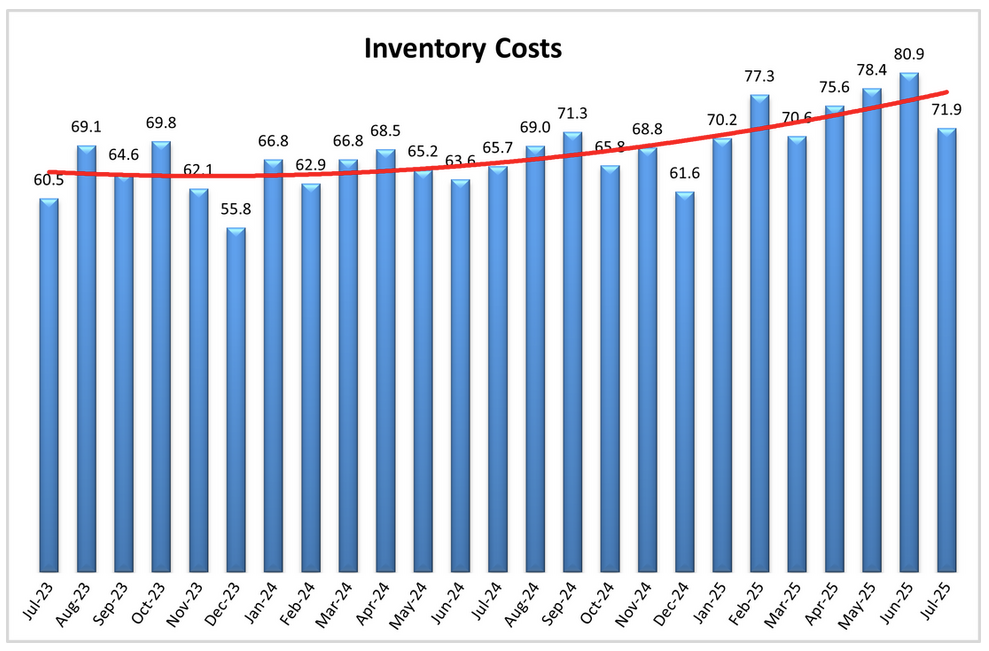
- Inventory Costs fell -9.0 pts to 71.9, still signaling robust expansion but at a slower pace; future expectations dropped -6.6 pts to 75.3.
- Inventory Levels declined -4.2 pts to 55.6, with large firms and Downstream respondents reporting contracting stock; expectations for the next year fell to 56.7.
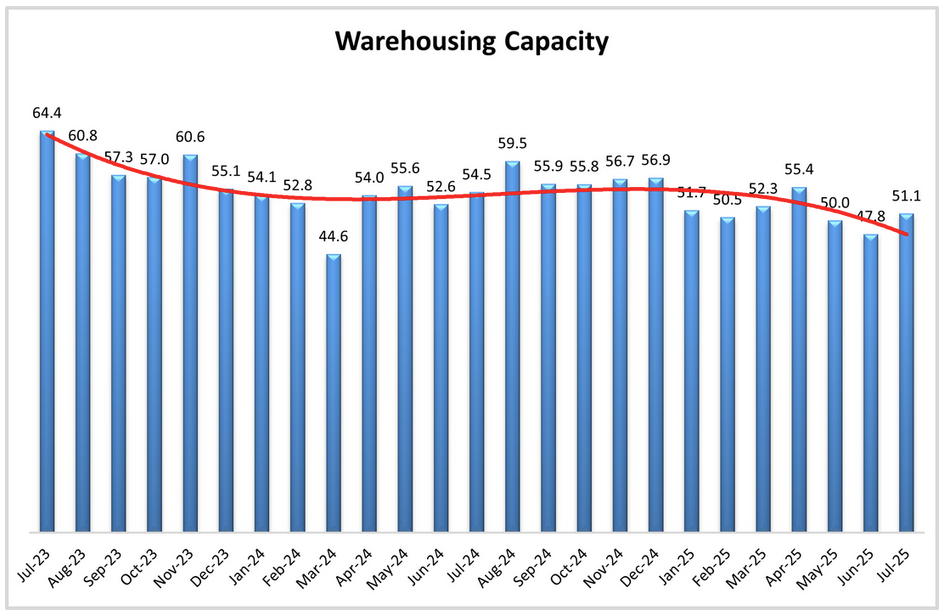
- Warehousing Capacity rose +3.3 pts to 51.1, returning to expansion for the first time in four months; future outlook edged up to 52.2.
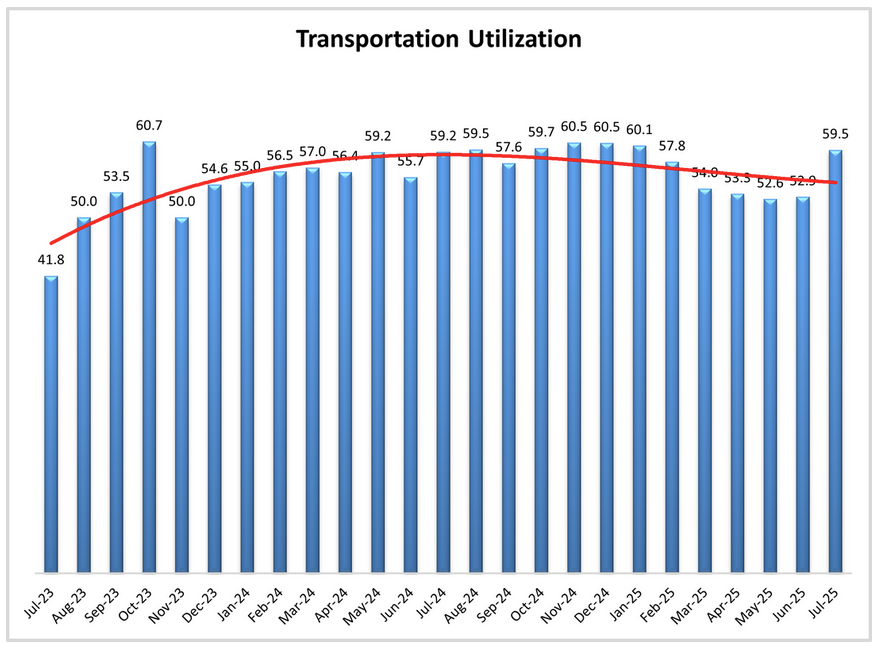
- Transportation Utilization jumped +6.6 pts to 59.5, the highest since January; future index rose +7.0 pts to 64.2.
- Transportation Prices increased +1.0 pt to 63.0, with future prices seen rising sharply to 75.5, especially Upstream.
-
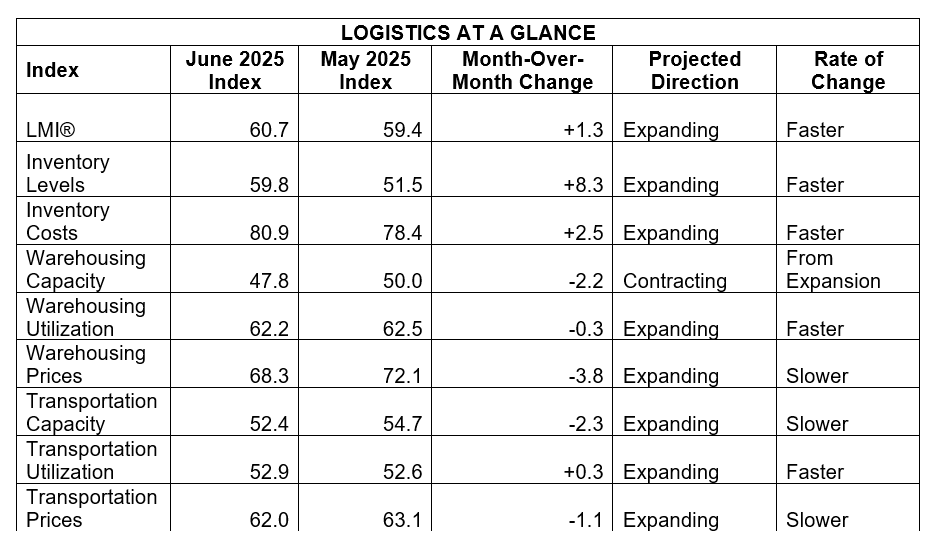
The Logistics Managers’ Index (LMI) rose to 60.7 in June, up +1.3 pts from May, marking the third reading above 60.0 in 2025 and signaling continued expansion in logistics activity, led by surging inventory and transportation costs.
- Inventory Levels surged +8.3 pts to 59.8, driven by a 22.2 pt Upstream-Downstream divergence; expectations for the next year rose to 62.5.
- Inventory Costs jumped +2.5 pts to 80.9 and are now up 19.3 pts from end-2024; future expectations hit 81.9.
- Warehousing Capacity slipped -2.2 pts to 47.8, entering contraction for the first time since March 2024; future outlook softened to 52.1.
- Warehousing Prices dropped -3.8 pts to 68.3, despite utilization remaining strong at 62.2; prices expected to rise to 75.5 over the next year.
- Transportation Utilization was up just 0.3 pts to 52.9, indicating just a slight expansion. The future index dropped -3.7 pts to 57.2.
- Transportation Capacity fell -2.3 pts to 52.4 (lowest in 12 months); Transportation Prices dropped -1.1 pts to 62.0, with a future index still elevated at 73.3.
-
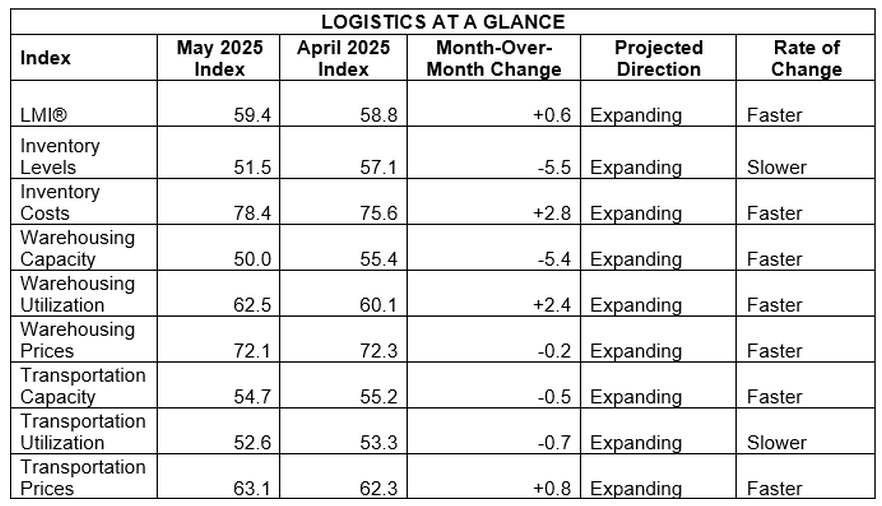
The Logistics Managers' Index (LMI) rose to 59.4 in May, up 0.6 pts from April, signaling continued expansion driven by rising inventory and transportation costs despite slower inventory accumulation and tighter capacity.
- Inventory Levels dropped -5.5 pts to 51.5, reflecting near-stagnation, while Inventory Costs surged +2.8 pts to 78.4, the highest since Oct 2022, creating a 26.8 pt spread, the third largest in index history.
- Warehousing Capacity fell -5.4 pts to 50.0, indicating no net change, while Warehousing Utilization increased +2.4 pts to 62.5 and Warehousing Prices held steady (-0.2 pts to 72.1).
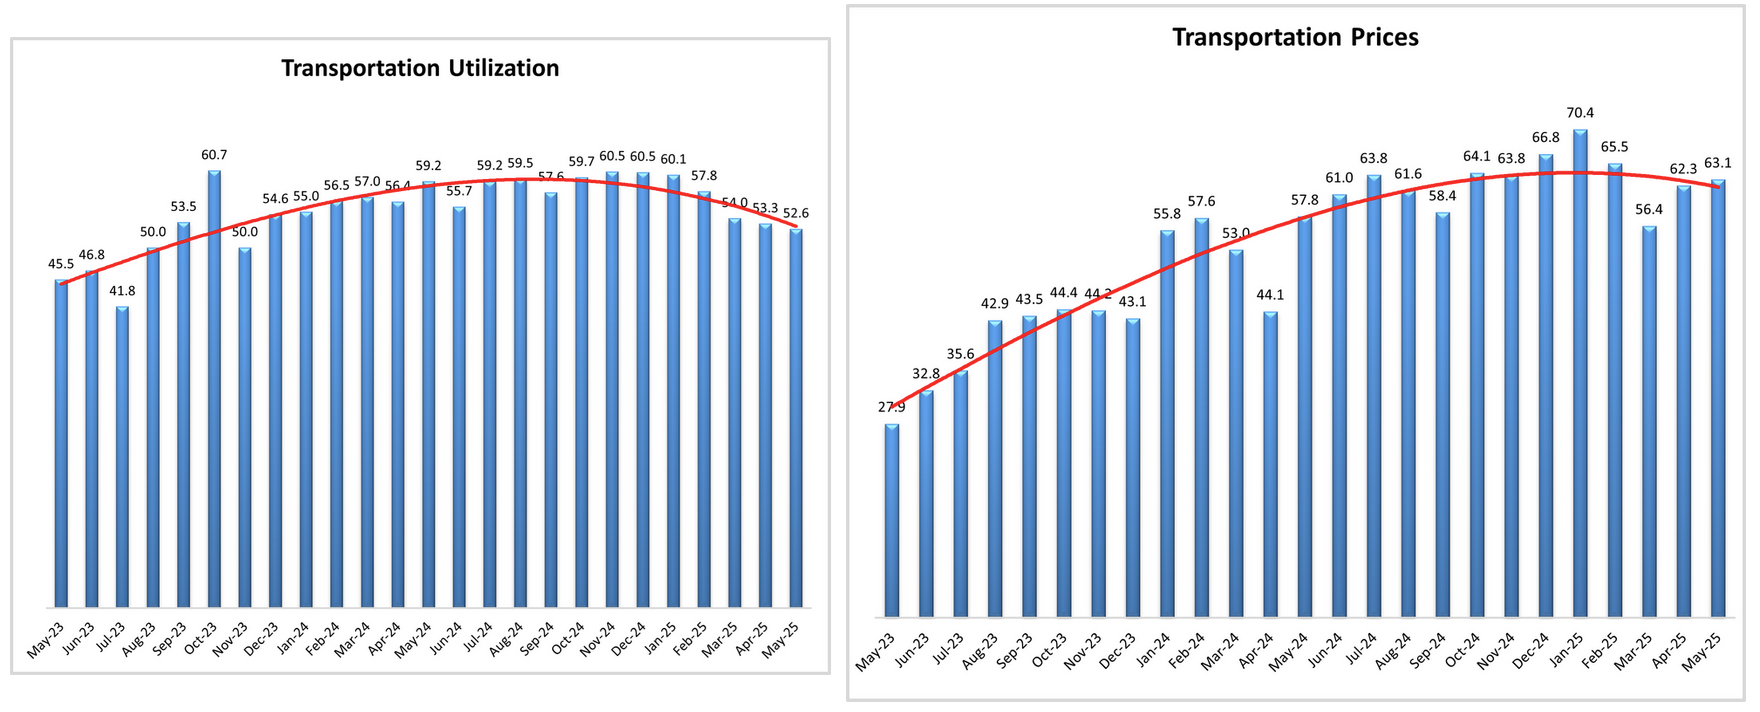
- Transportation metrics were stable: Capacity dipped -0.5 pts to 54.7, Utilization declined -0.7 pts to 52.6, and Prices rose +0.8 pts to 63.1.
- Small firms reported more logistics activity than large ones, with a higher overall LMI (63.1 vs 56.2), higher Inventory Levels (57.4 vs 46.1), and higher Inventory Costs (85.9 vs 71.6).
- Future expectations point to continued cost pressure: Inventory Costs (78.9), Warehousing Prices (79.4), and Transportation Prices (75.0) are all forecasted to expand, while capacity is expected to remain tight (Transportation Capacity: 50.0, Warehousing Capacity: 53.9).
-
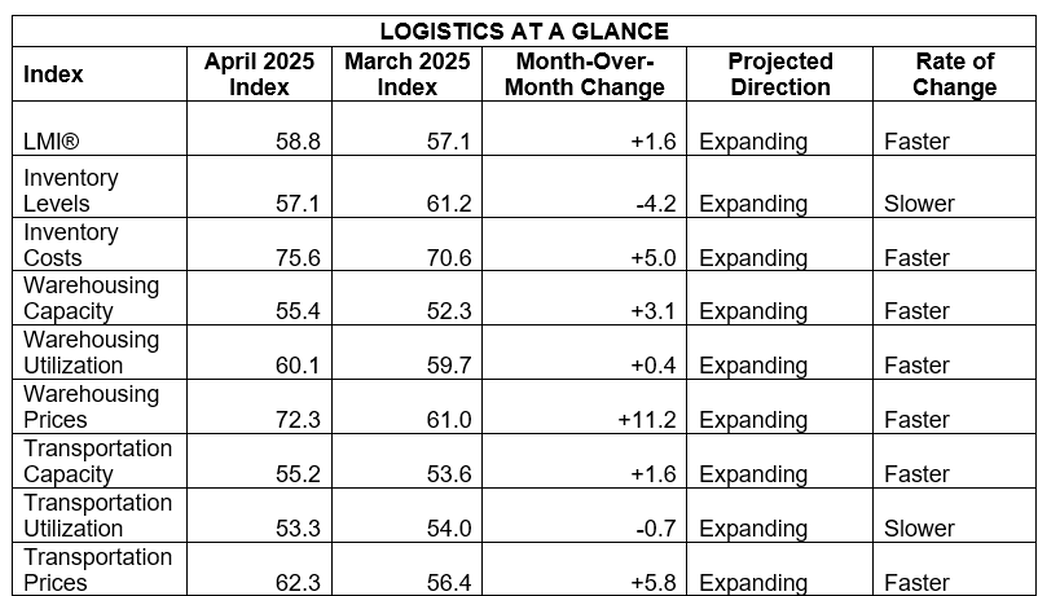
The Logistics Managers’ Index rose to 58.8 in April, up 1.7 pts from March, reflecting ongoing expansion driven by rising storage and transportation costs despite slower inventory growth.
- Inventory Costs jumped 5.0 pts to 75.6 and Warehousing Prices surged 11.2 pts to 72.3, suggesting stagnant inventory is becoming expensive to hold as it has not yet been sold to consumers.
- “The movements in inventories we observed from January to mid-March are very similar to the movements we would normally see from August to mid-October. The difference being that when inventories crest in mid-October, it is because they are about to be sold during the holiday season. The inventories that have been built up now will likely be sold more slowly, leading to higher storage costs across the board.”
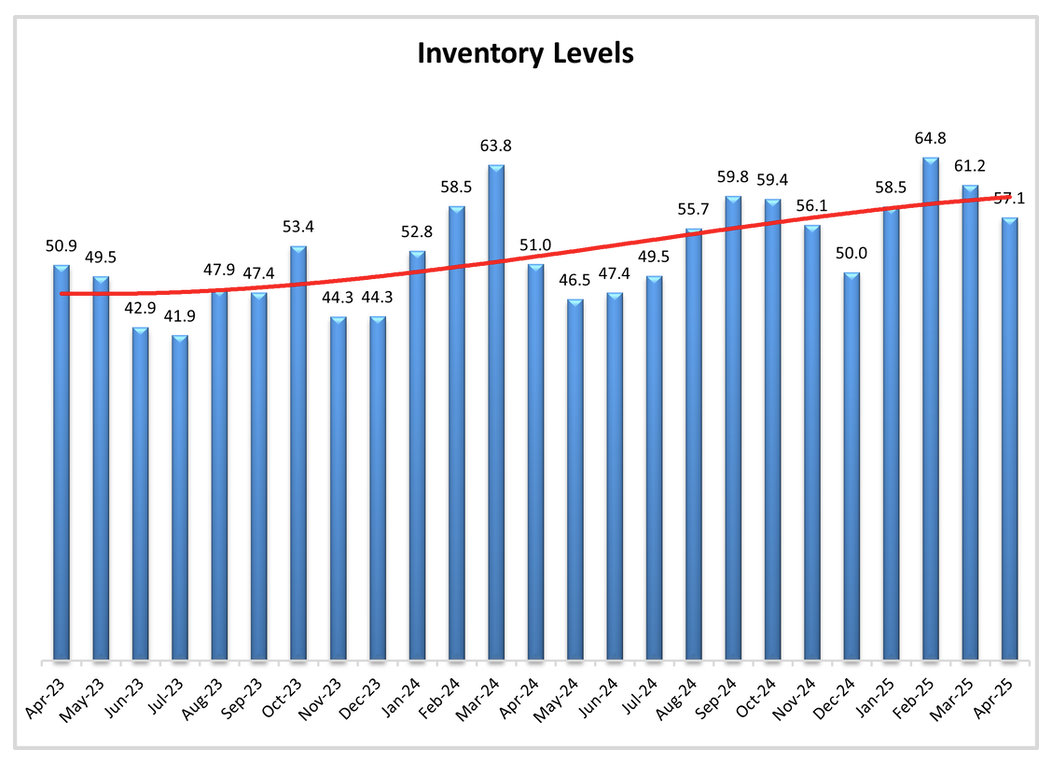
- Inventory Levels slowed to 57.1 (-4.1 pts MoM) as the Q1 tariff-driven buildup eased; Warehousing Capacity rose slightly to 55.4.
- Transportation Prices climbed 5.9 pts to 62.3, driven largely by Downstream firms, while Transportation Utilization edged down -0.7 pts to 53.3.
- Downstream firms anticipate sharp increases in Inventory Costs (forecast at 94.0) and Warehousing Prices (84.8), compared to more modest forecasts from Upstream respondents.
- Future LMI expansion is expected at 60.6, unchanged from March, with a pronounced divergence between bullish retail-level (Downstream) and cautious industrial (Upstream) outlooks.
- In the next year, upstream respondents expect a significant decline in inventories while Downstream respondents expect a significant increase in inventories.