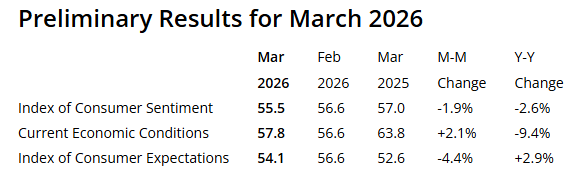
 Consumer sentiment dipped about 2%, reaching its lowest reading of the year. Interviews completed prior to the military action in Iran showed an improvement in sentiment from last month, but lower readings seen during the nine days thereafter completely erased those initial gains. Gasoline prices have exerted the most immediate impact felt by consumers, though the magnitude of passthrough to other prices remains highly uncertain. A broad swath of consumers across incomes, age, and political affiliation all reported declines in expectations for their personal finances, down 7.5% nationally. Interviews for this release were collected between February 17 and March 9, with about half completed after the start of the US military conflict in Iran.
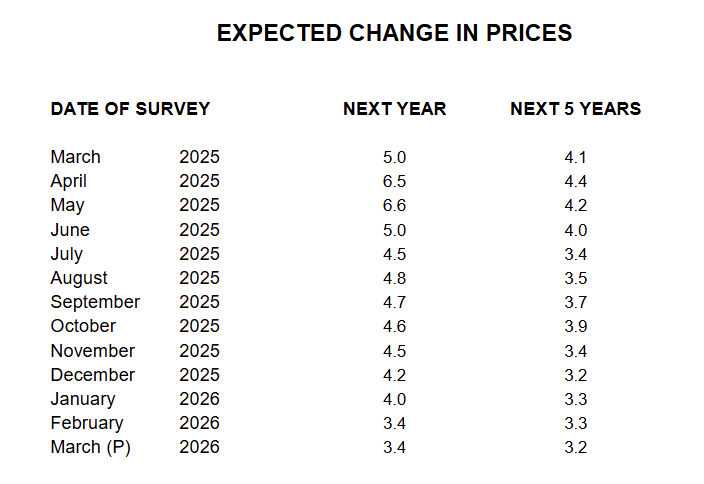
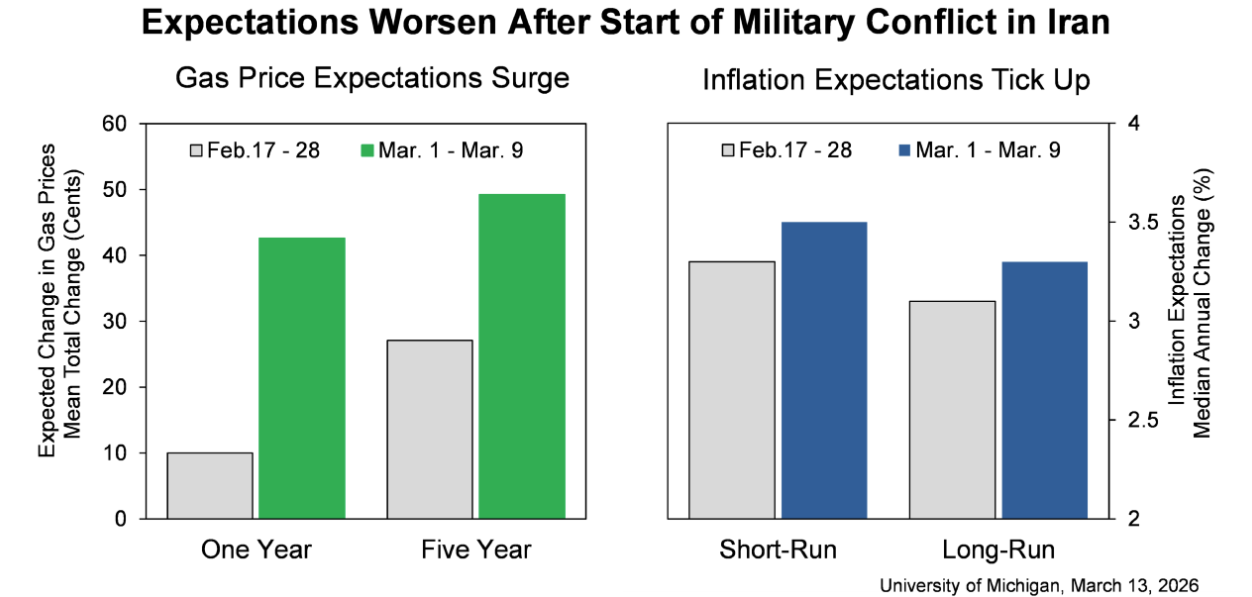
This month, year-ahead inflation expectations ended six months of consecutive declines, stalling at 3.4%. The current reading exceeds those seen in 2024 and remains well above the 2.3-3.0% range seen in the two years pre-pandemic. Long-run inflation expectations inched down to 3.2%. In 2024, readings ranged between 2.8% and 3.2%, while in 2019 and 2020, they were consistently below 2.8%. Note that for both time horizons, interviews completed after February 28th exhibited higher inflation expectations than those completed before that date (see chart, right panel).