
US Existing Home Sales
About
-
July 9th, 2026 · 10:00 AM
-
August 11th, 2026 · 10:00 AM
-
September 10th, 2026 · 10:00 AM
-
October 13th, 2026 · 10:00 AM
-
November 12th, 2026 · 10:00 AM
-
December 9th, 2026 · 10:00 AM
Latest Releases
12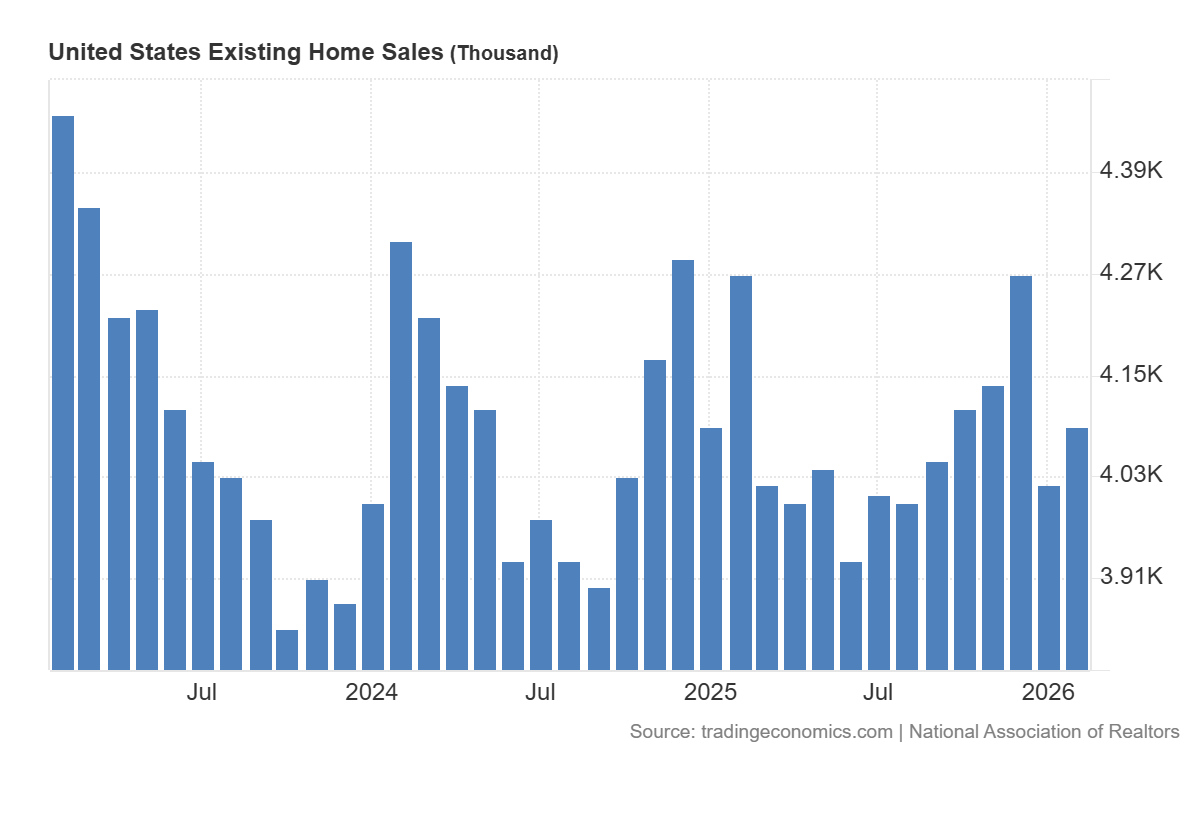
U.S. existing-home sales rose +1.7% MoM in February to a 4.09M SAAR but remained -1.4% YoY, reflecting a modest rebound in transactions amid gradually improving affordability conditions.
-
Total existing-home sales increased +1.7% MoM to a seasonally adjusted annual rate of 4.09M in February but declined -1.4% YoY, indicating a modest monthly recovery while overall activity remains below year-earlier levels.
-
Housing inventory rose to 1.29M units (+2.4% MoM, +4.9% YoY), with unsold inventory equal to a 3.8-month supply (unchanged MoM, up from 3.6 months YoY), showing gradually improving supply conditions.
-
The median existing-home price increased +0.3% YoY to $398,000, marking the 32nd consecutive month of annual price gains and highlighting continued price resilience despite subdued transaction volumes.
-
Housing affordability improved for the eighth consecutive month, with the Housing Affordability Index rising to 117.6 (+0.5 pts MoM; +14.5 pts YoY), the highest reading since March 2022.
-
Single-family home sales rose +2.5% MoM to a 3.73M SAAR but were -1.1% YoY, while the median single-family price increased +0.2% YoY to $401,800, indicating modest price appreciation alongside slightly weaker annual sales.
-
Condo and co-op sales fell -5.3% MoM to a 360k SAAR and were -5.3% YoY, while the median price increased +0.9% YoY to $358,100, showing sharper sales declines in this segment despite stronger annual price growth.
-
Regional sales performance was mixed MoM: Northeast -6.0% MoM (-4.1% YoY), Midwest +1.1% MoM (-4.1% YoY), South +1.6% MoM (+0.5% YoY), and West +8.2% MoM (-1.3% YoY), indicating uneven regional housing market dynamics.
-
The median time on market rose to 47 days (Jan: 46; YoY: 42), while first-time buyers accounted for 34% of purchases (Jan: 31%; YoY: 31%), suggesting slightly slower turnover alongside stronger participation from first-time buyers.
-
The average 30-year fixed mortgage rate declined to 6.05% in February (Jan: 6.10%; YoY: 6.84%), aligning with the continued improvement in affordability conditions reported in the index.
U.S. existing-home sales fell -8.4% MoM in January to a 3.91M SAAR and declined -4.4% YoY, reflecting broad-based weakness despite improved affordability.
-
Total housing inventory slipped -0.8% MoM to 1.22M units but rose +3.4% YoY, with months’ supply at 3.7 (up from 3.5 in December and one year ago), indicating slightly more availability than a year earlier but still relatively tight supply.
-
The median existing-home price increased +0.9% YoY to $396,800, marking the 31st consecutive YoY gain and a new January high, consistent with ongoing price resilience amid limited supply.
-
The Housing Affordability Index rose to 116.5 (from 111.6 in December and 102.0 YoY), improving for a seventh straight month, with gains across all regions led by the West (+17.1%) and South (+15.2%).
-
Single-family sales fell -9.0% MoM to 3.53M SAAR and -4.3% YoY, while the median single-family price rose +0.6% YoY to $400,300, showing softer volumes alongside modest price growth.
-
Condo and co-op sales declined -2.6% MoM to 380k SAAR and -5.0% YoY, with the median price up +3.8% YoY to $364,600, indicating stronger annual price appreciation than single-family despite weaker sales.
-
All regions posted MoM and YoY sales declines, with the West -10.3% MoM (-7.9% YoY) and the South -9.0% MoM (-1.6% YoY), while the Northeast saw prices rise +5.8% YoY to $505,400 and the West recorded a -1.4% YoY price decline.
-
The median time on market rose to 46 days (from 39 in December and 41 YoY), suggesting slightly slower turnover, while first-time buyers accounted for 31% of sales (up from 29% MoM and 28% YoY).
-
The average 30-year fixed mortgage rate declined to 6.10% (from 6.19% in December and 6.96% YoY), aligning with improved affordability conditions even as sales volumes contracted.
U.S. existing-home sales rose +5.1% MoM in December to a 4.35 million (vs 4.21 million) SAAR and increased +1.4% YoY, marking the strongest seasonally adjusted pace in nearly three years amid improving late-2025 conditions.
-
Total housing inventory fell to 1.18 million units (-18.1% MoM, +3.5% YoY), pushing months’ supply down to 3.3 months (from 4.2 in November), signaling tighter near-term availability despite slightly higher stock than a year ago.
-
The median existing-home price rose +0.4% YoY to $405,400, extending 30 consecutive months of YoY price gains, though the report noted slower home price growth in Q4.
-
Single-family sales increased +5.1% MoM to 3.95M SAAR and were up +1.8% YoY, while the median single-family price rose +0.2% YoY to $409,500, indicating modest price appreciation alongside stronger volumes.
-
Condo and co-op sales rose +5.3% MoM to 400k SAAR but were down -2.4% YoY; the median condo price increased +1.5% YoY to $364,400, showing firmer annual pricing than the single-family segment despite weaker YoY sales.
-
Regional performance was broadly positive MoM, with the Northeast +2.0%, South +6.9%, and West +6.6%, offset by a -2.0% MoM decline in the Midwest; YoY sales rose in the South (+3.6%), were flat in the Midwest and West, and fell in the Northeast (-1.9%).
-
Price trends varied by region, with median prices up +3.7% YoY in the Northeast ($496,700) and +3.1% YoY in the Midwest ($306,000), while the South fell -0.3% YoY ($360,200) and the West fell -1.4% YoY ($605,600).
-
The average 30-year fixed mortgage rate eased to 6.19% in December (from 6.24% in November and 6.72% a year earlier), consistent with the report’s view that lower mortgage rates helped support Q4 sales improvement.
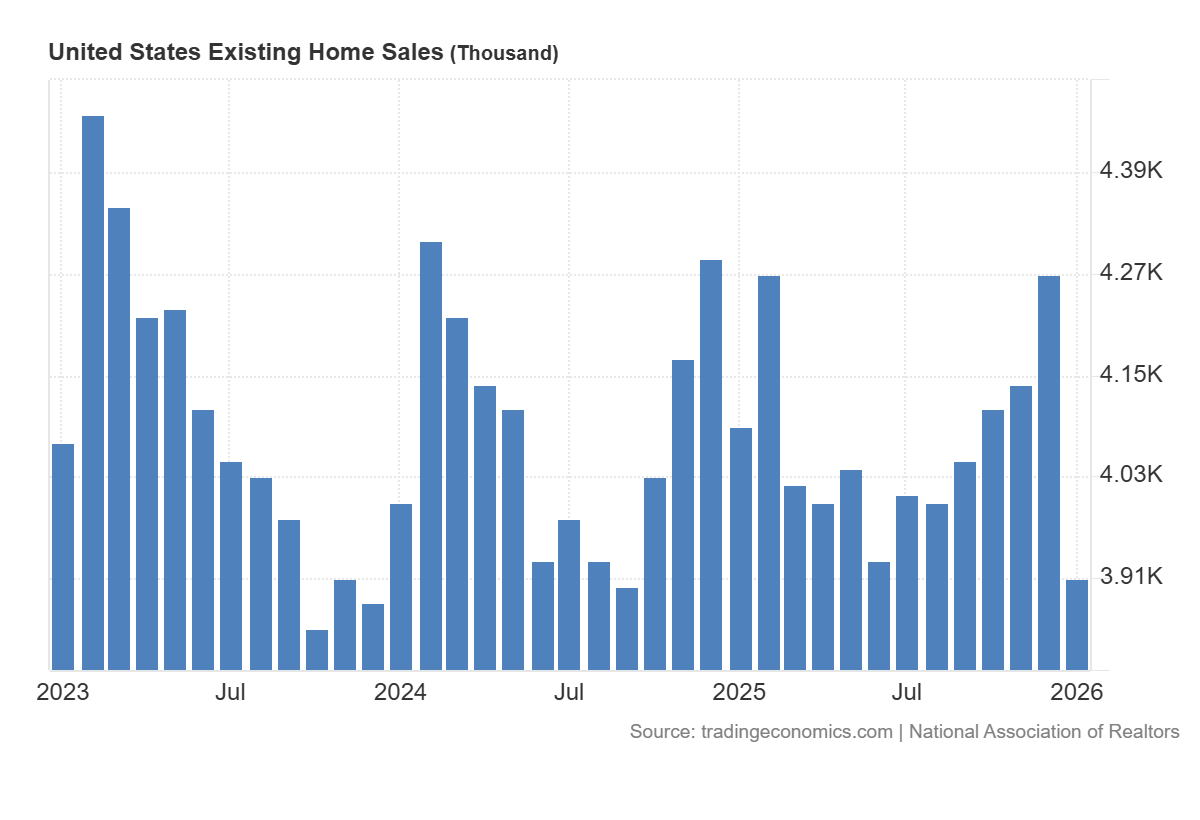
U.S. existing-home sales rose +0.5% MoM in November to a 4.13 million (vs 4.2 million expected) SAAR while falling -1.0% YoY, extending a modest late-year recovery.
-
Total housing inventory declined -5.9% MoM to 1.43M units but was up +7.5% YoY, with months’ supply easing to 4.2 months (from 4.4), indicating slightly tighter near-term conditions despite higher annual stock.
-
The median existing-home price increased +1.2% YoY to $409,200, moderating from a +2.1% YoY increase in October.
-
Single-family home sales rose +0.8% MoM to 3.75M SAAR but were down -0.8% YoY; the median price increased +1.2% YoY to $414,300, showing continued outperformance versus condos.
-
Condominium and co-op sales fell -2.6% MoM and -2.6% YoY to 380k SAAR, with the median price up just +0.1% YoY to $358,600.
-
Regionally, sales increased MoM in the Northeast (+4.1%) and South (+1.1%), declined in the Midwest (-2.0%), and were unchanged in the West; YoY, the Midwest (-3.0%) and West (-1.3%) remained weaker.
-
Homes spent a median of 36 days on the market (vs 34 days in October and 32 days a year earlier), indicating a gradual lengthening of selling times.
-
First-time buyers accounted for 30% of purchases (unchanged YoY), cash buyers represented 27% (down from 29% MoM), and investors or second-home buyers rose to 18% (from 16% MoM).
-
The average 30-year fixed mortgage rate fell to 6.24% in November (from 6.25% in October and 6.81% one year earlier), providing incremental financing relief.
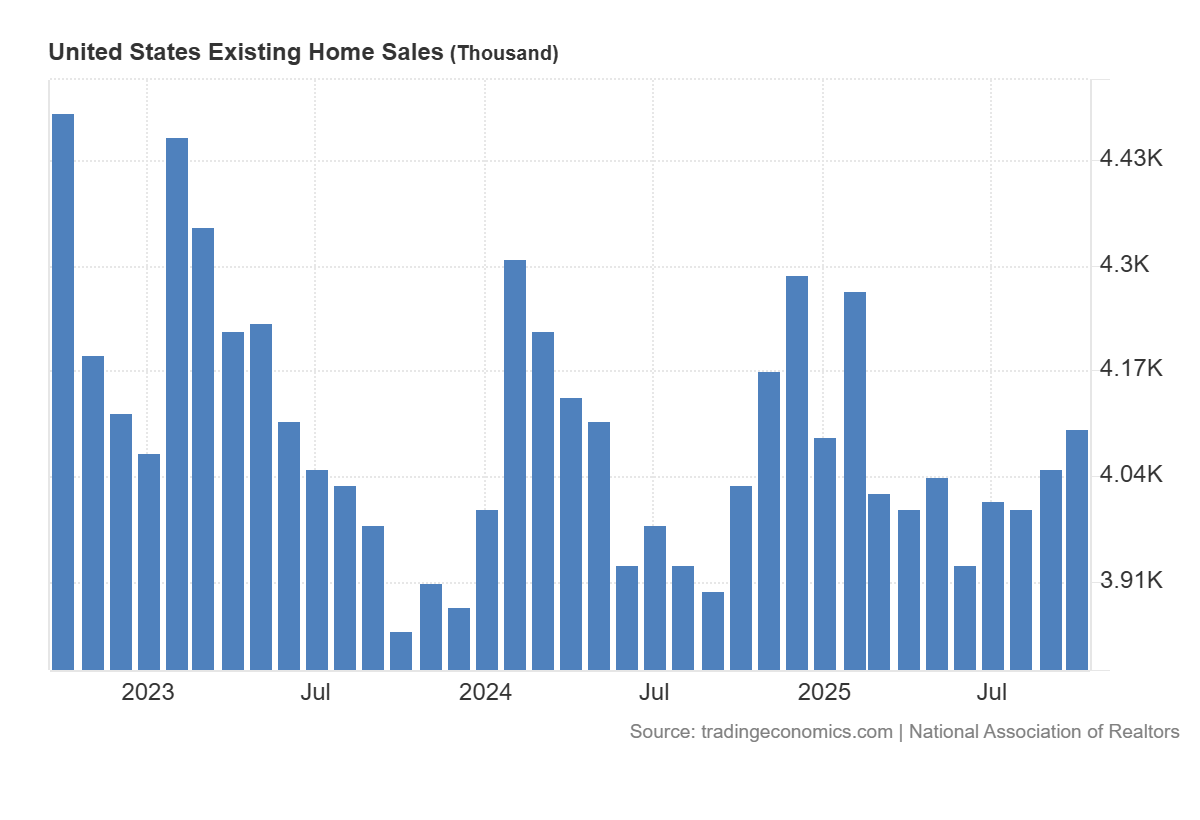
U.S. existing-home sales rose +1.2% MoM in October to a 4.10M SAAR (vs 4.08M SAAR expected), while sales increased +1.7% YoY. This is the fastest monthly sales pace since February.
-
Total housing inventory declined -0.7% MoM to 1.52M units, though levels were +10.9% YoY, and months’ supply eased to 4.4 months (from 4.5), indicating slightly tighter conditions than in September.
-
The median existing-home price rose +2.1% YoY to $415,200, marking the 28th straight month of annual price gains.
-
Single-family sales rose +0.8% MoM to 3.71M SAAR (+1.9% YoY), with the median price up +2.2% YoY to $420,600.
-
Condo/co-op sales increased +5.4% MoM to 390k SAAR (flat YoY), while the median price rose +0.9% YoY to $363,700.
-
Regionally, sales were unchanged in the Northeast, up in the Midwest (+5.3% MoM) and South (+0.5%), and down in the West (-1.3% MoM); YoY, only the West posted a decline (-2.6%).
-
Homes spent a median of 34 days on market (33 in September; 29 last year), showing a slight lengthening of selling times.
-
First-time buyers accounted for 32% of purchases (up from 27% a year ago), while cash buyers made up 29% of transactions.
-
The average 30-year mortgage rate fell to 6.25% (from 6.35% in September and 6.43% one year earlier), providing modest financing relief.
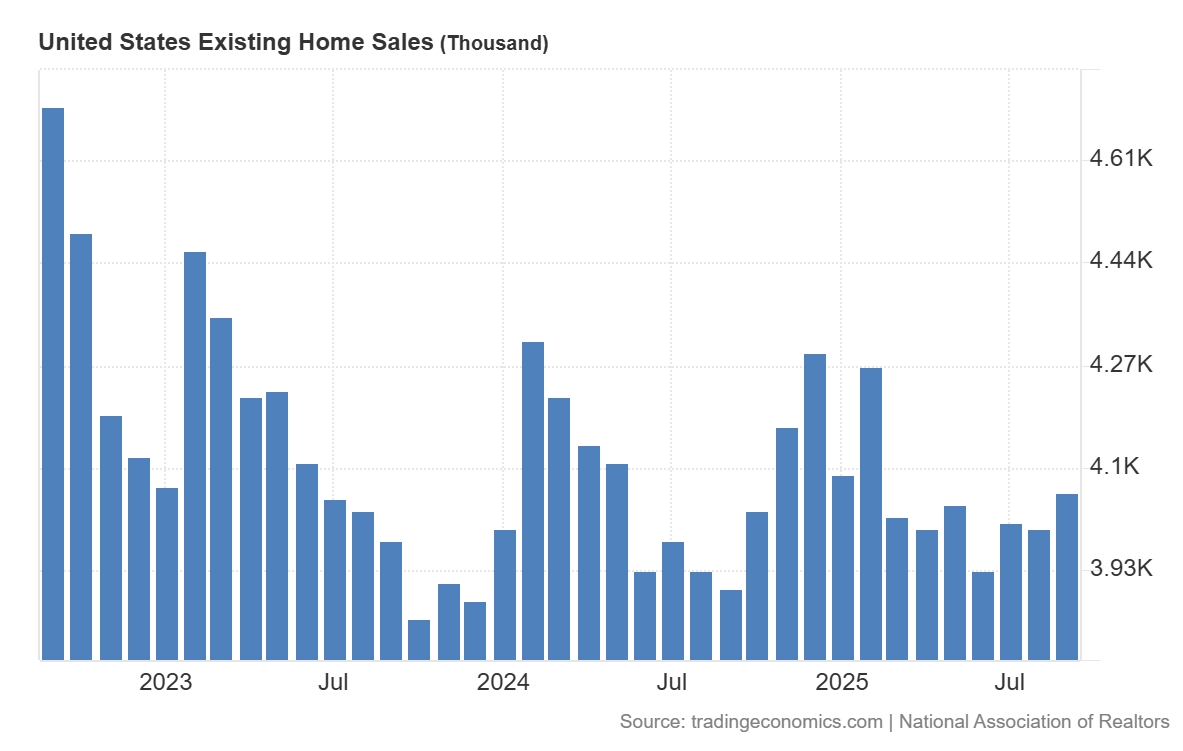
U.S. existing-home sales rose +1.5% MoM in September 2025 to a SAAR of 4.06 million, while sales were up +4.1% YoY, marking the second straight monthly gain as lower mortgage rates improved affordability.
-
Total housing inventory increased +1.3% MoM to 1.55M units (+14.0% YoY), equal to 4.6 months’ supply, matching a five-year high though still below pre-COVID levels.
-
The median existing-home price reached $415,200, up +2.1% YoY, marking the 27th consecutive month of annual price growth.
-
Single-family home sales rose +1.7% MoM to 3.69M SAAR (+4.5% YoY), with the median price at $420,700 (+2.3% YoY).
-
Condo/co-op sales held steady MoM and YoY at 370,000 units, with the median price down -0.6% YoY to $360,300.
-
Regionally, sales increased in the Northeast (+2.1% MoM, +4.3% YoY), South (+1.6% MoM, +6.9% YoY), and West (+5.5% MoM, flat YoY), but fell in the Midwest (-2.1% MoM, +2.2% YoY).
-
Median prices rose across regions: Midwest (+4.7% YoY), Northeast (+4.1%), South (+1.2%), and West (+0.4%).
-
Properties spent a median of 33 days on the market (Aug: 31 days; Sep 2024: 28 days).
-
First-time buyers accounted for 30% of sales (Jul: 28%), while cash sales also made up 30% of total transactions.
-
Distressed sales remained minimal at 2%, unchanged MoM and YoY, underscoring financial stability among homeowners.
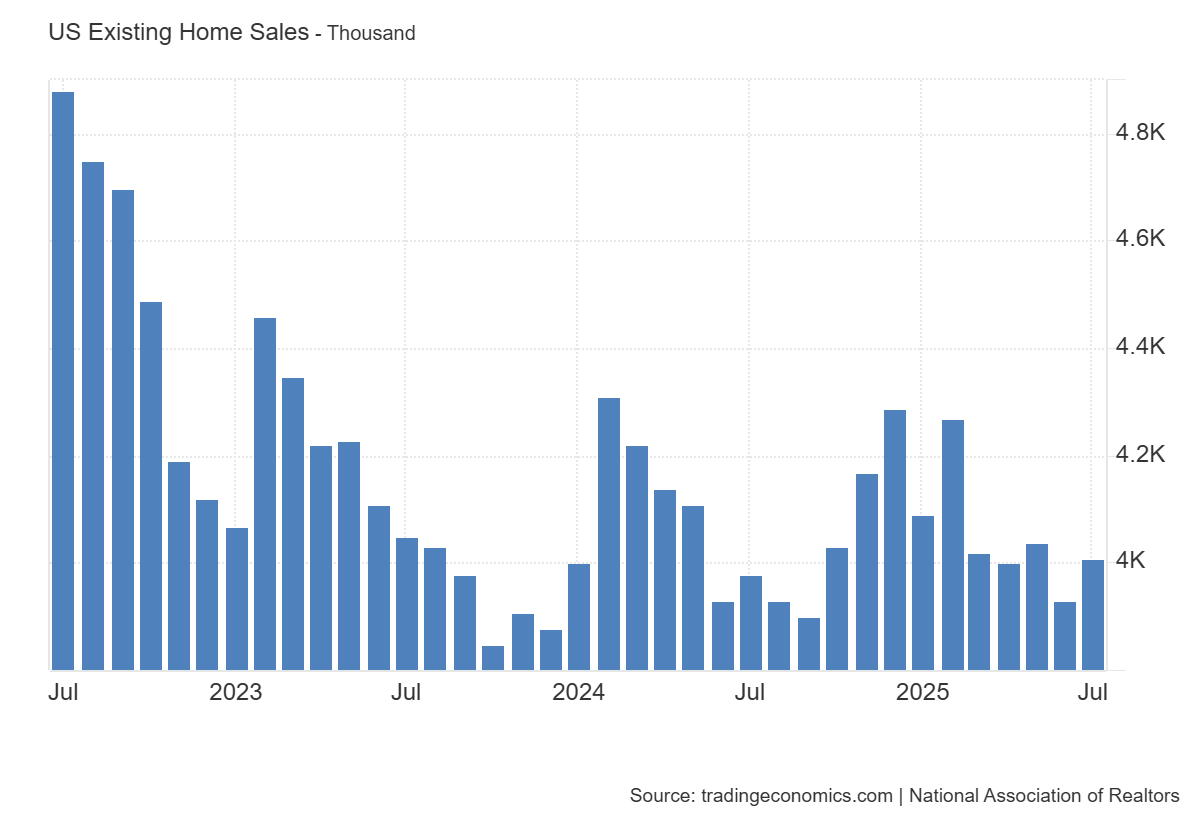
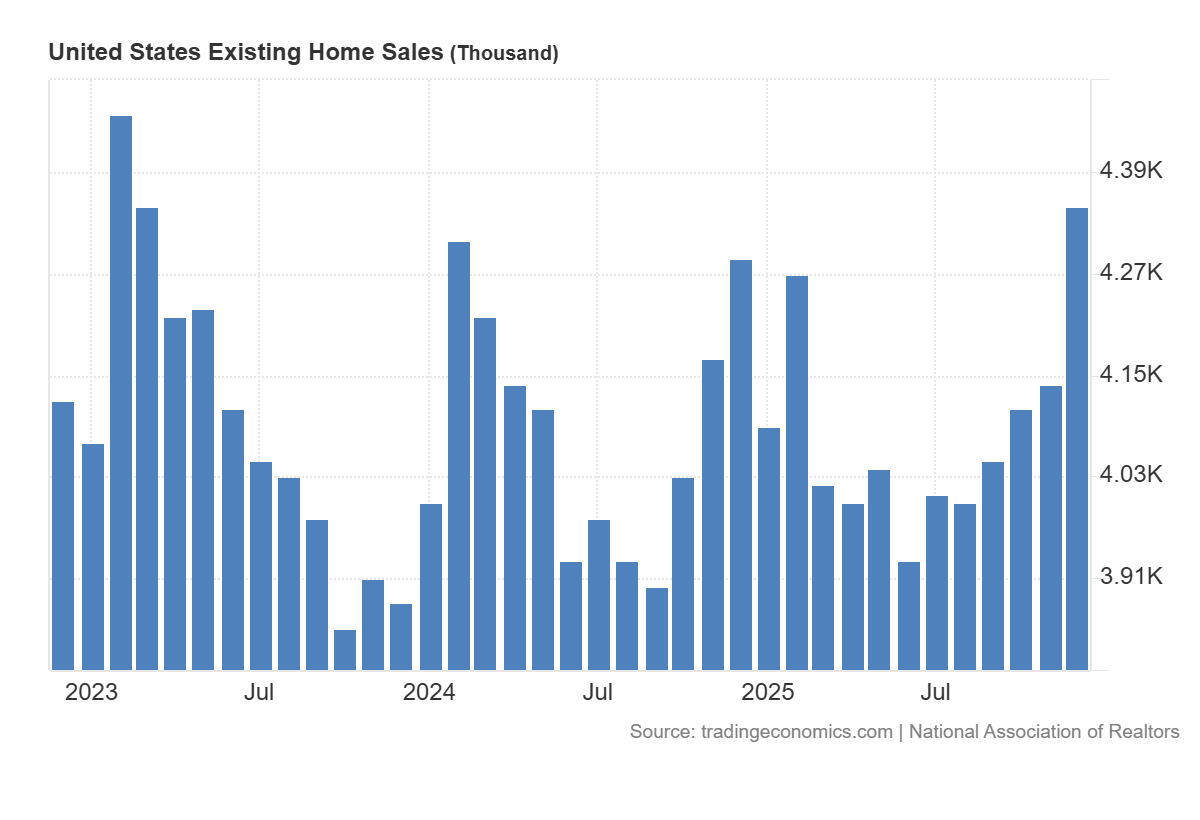
Existing-home sales slipped -0.2% MoM in August 2025 to a SAAR of 4.0 million, though sales were up +1.8% YoY, showing modest improvement versus last year.
-
Total housing inventory fell -1.3% MoM to 1.53 million units, equal to 4.6 months’ supply; compared with August 2024, inventory was up +11.7%.
-
The median existing-home price was $422,600, up +2.0% YoY and marking the 26th straight annual increase, though price growth remains modest.
-
Single-family home sales declined -0.3% MoM to 3.63 million SAAR but rose +2.5% YoY; the median price was $427,800 (+1.9% YoY).
-
Condo/co-op sales held steady MoM at 370,000 units but dropped -5.1% YoY; the median price edged up +0.6% YoY to $366,800.
-
Regionally, sales rose in the Midwest (+2.1% MoM, +3.2% YoY) and West (+1.4% MoM, -1.4% YoY), but declined in the South (-1.1% MoM, +3.4% YoY) and Northeast (-4.0% MoM, -2.0% YoY).
-
Properties spent a median of 31 days on the market, up from 28 days in July and 26 days a year earlier.
-
First-time buyers made up 28% of sales, unchanged MoM but above August 2024 (26%), while cash sales accounted for 28%, down from 31% in July but higher YoY.
-
The average 30-year fixed mortgage rate was 6.59% in August, easing from 6.72% in July but slightly above the 6.50% rate one year earlier.
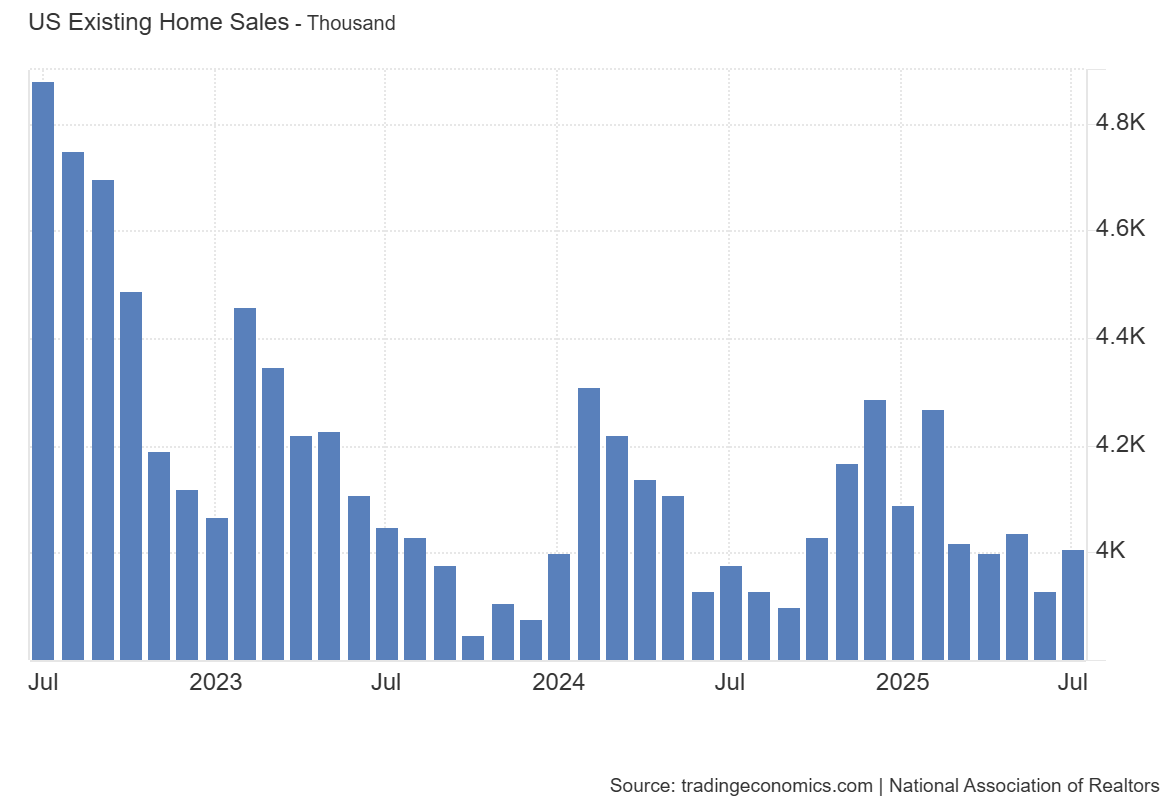
US existing-home sales rose +2.0% MoM in July 2025 to a SAAR of 4.01 million (vs 3.92 million expected), and were up +0.8% YoY, supported by easing mortgage rates and improving affordability.
-
Total housing inventory reached 1.55 million units, up +0.6% MoM and +15.7% YoY; months’ supply stood at 4.6, slightly below June (4.7) but above July 2024 (4.0).
-
The median existing-home price was $422,400, up +0.2% YoY, marking the 25th straight annual increase, though price growth remains subdued.
-
Single-family home sales increased +2.0% MoM to 3.64 million SAAR (+1.1% YoY), with the median price at $428,500 (+0.3% YoY).
-
Condo/co-op sales rose +2.8% MoM to 370,000 units but fell -2.6% YoY; the median price declined -1.2% YoY to $362,600.
-
Regionally, sales rose in the Northeast (+8.7% MoM, +2.0% YoY), South (+2.2% MoM, +2.2% YoY), and West (+1.4% MoM, -4.0% YoY), while the Midwest saw a -1.1% MoM decline but was up +1.1% YoY.
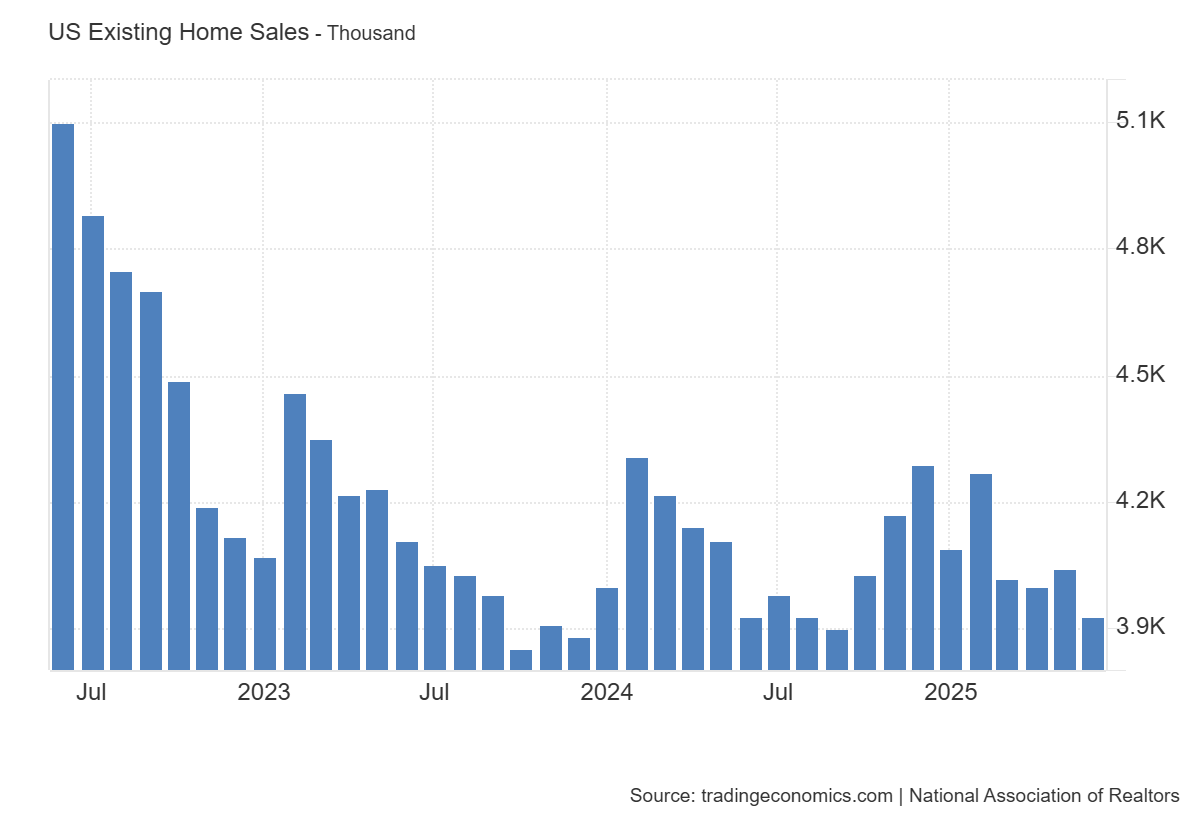
US existing-home sales fell -2.7% MoM in June 2025 to a seasonally adjusted annual rate (SAAR) of 3.93 million units, with no change YoY, as high mortgage rates and limited affordability continued to constrain activity.
- Total housing inventory slipped -0.6% MoM to 1.53 million units, but was up +15.9% YoY; months’ supply edged up to 4.7 from 4.6 in May.
- The median existing-home price hit a record $435,300 in June, up +2.0% YoY, marking the 24th straight month of annual price gains.
- Single-family home sales declined -3.0% MoM to 3.57 million units SAAR (+0.6% YoY), while condo/co-op sales were flat MoM and down -5.3% YoY.
- Regionally, sales fell MoM in the Northeast (-8.0%), Midwest (-4.0%), and South (-2.2%) but rose in the West (+1.4%); YoY sales were down in the Northeast and West but up in the Midwest and South.
- First-time buyers accounted for 30% of purchases (unchanged MoM, up from 29% YoY); cash buyers made up 29% of sales, and investor activity fell to 14%, the lowest since Sept. 2022.
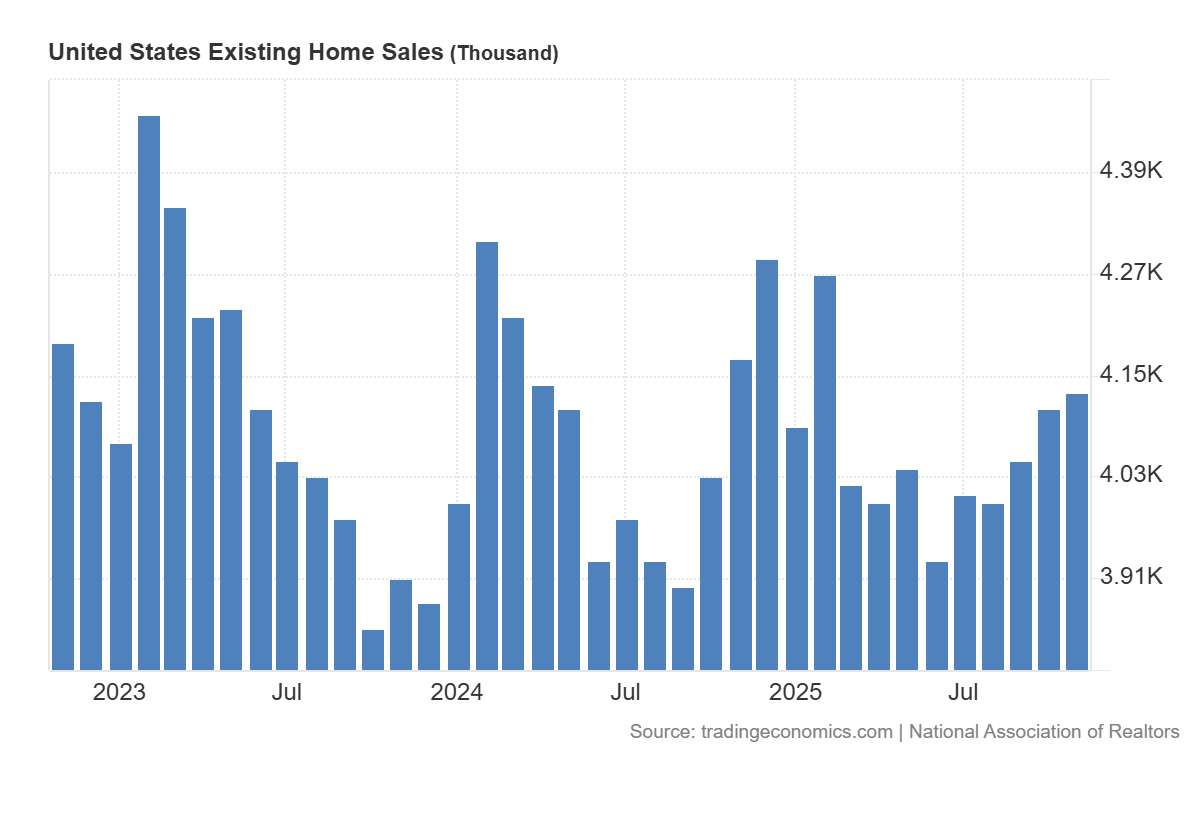
US existing-home sales rose 0.8% MoM (vs -1.3% MoM) in May to a SAAR of 4.03 million units but fell -0.7% YoY, with persistently high mortgage rates weighing on activity.
- Housing inventory increased 6.2% MoM and 20.3% YoY to 1.54 million units (4.6 months’ supply, up from 4.4 in April).
- The median existing-home price hit a May record at $422,800, up 1.3% YoY.
- Single-family home sales rose 1.1% MoM to 3.67 million (up 0.3% YoY); condo/co-op sales fell -2.7% MoM and -10.0% YoY.
- Regionally, sales rose MoM in the Northeast (+4.2%), Midwest (+2.1%), and South (+1.7%) but fell sharply in the West (-5.4%).
- First-time buyers made up 30% of purchases (down from 34% in April); cash sales rose to 27% of transactions.