
US Existing Home Sales: September 2025
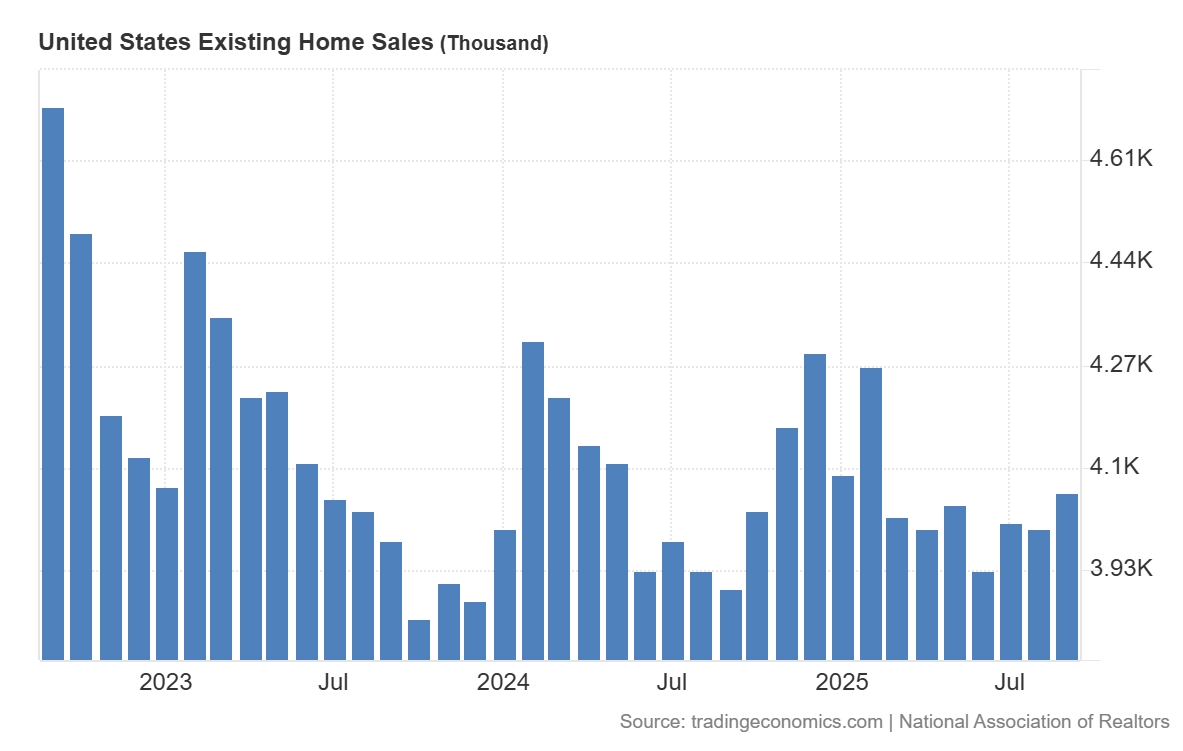
U.S. existing-home sales rose +1.5% MoM in September 2025 to a SAAR of 4.06 million, while sales were up +4.1% YoY, marking the second straight monthly gain as lower mortgage rates improved affordability.
-
Total housing inventory increased +1.3% MoM to 1.55M units (+14.0% YoY), equal to 4.6 months’ supply, matching a five-year high though still below pre-COVID levels.
-
The median existing-home price reached $415,200, up +2.1% YoY, marking the 27th consecutive month of annual price growth.
-
Single-family home sales rose +1.7% MoM to 3.69M SAAR (+4.5% YoY), with the median price at $420,700 (+2.3% YoY).
-
Condo/co-op sales held steady MoM and YoY at 370,000 units, with the median price down -0.6% YoY to $360,300.
-
Regionally, sales increased in the Northeast (+2.1% MoM, +4.3% YoY), South (+1.6% MoM, +6.9% YoY), and West (+5.5% MoM, flat YoY), but fell in the Midwest (-2.1% MoM, +2.2% YoY).
-
Median prices rose across regions: Midwest (+4.7% YoY), Northeast (+4.1%), South (+1.2%), and West (+0.4%).
-
Properties spent a median of 33 days on the market (Aug: 31 days; Sep 2024: 28 days).
-
First-time buyers accounted for 30% of sales (Jul: 28%), while cash sales also made up 30% of total transactions.
-
Distressed sales remained minimal at 2%, unchanged MoM and YoY, underscoring financial stability among homeowners.