
US Existing Home Sales: August 2025
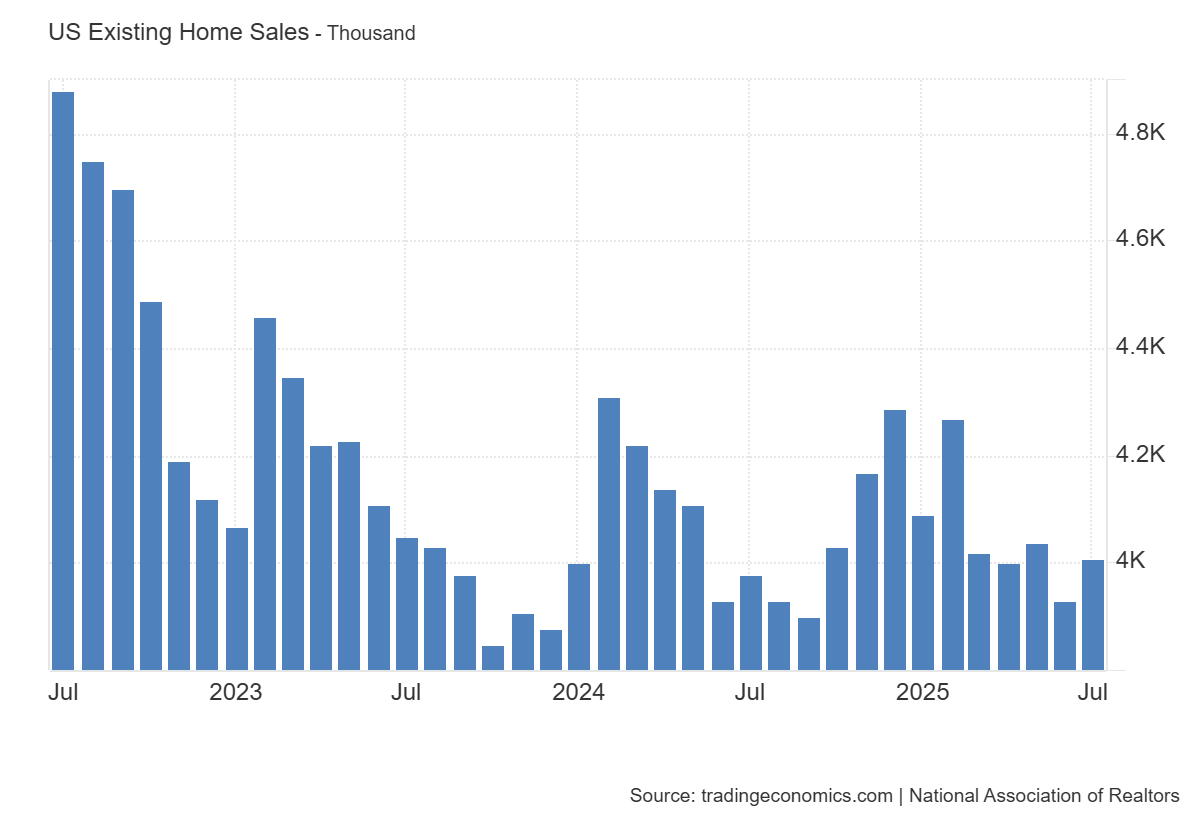
Existing-home sales slipped -0.2% MoM in August 2025 to a SAAR of 4.0 million, though sales were up +1.8% YoY, showing modest improvement versus last year.
-
Total housing inventory fell -1.3% MoM to 1.53 million units, equal to 4.6 months’ supply; compared with August 2024, inventory was up +11.7%.
-
The median existing-home price was $422,600, up +2.0% YoY and marking the 26th straight annual increase, though price growth remains modest.
-
Single-family home sales declined -0.3% MoM to 3.63 million SAAR but rose +2.5% YoY; the median price was $427,800 (+1.9% YoY).
-
Condo/co-op sales held steady MoM at 370,000 units but dropped -5.1% YoY; the median price edged up +0.6% YoY to $366,800.
-
Regionally, sales rose in the Midwest (+2.1% MoM, +3.2% YoY) and West (+1.4% MoM, -1.4% YoY), but declined in the South (-1.1% MoM, +3.4% YoY) and Northeast (-4.0% MoM, -2.0% YoY).
-
Properties spent a median of 31 days on the market, up from 28 days in July and 26 days a year earlier.
-
First-time buyers made up 28% of sales, unchanged MoM but above August 2024 (26%), while cash sales accounted for 28%, down from 31% in July but higher YoY.
-
The average 30-year fixed mortgage rate was 6.59% in August, easing from 6.72% in July but slightly above the 6.50% rate one year earlier.