
US Existing Home Sales: January 2026
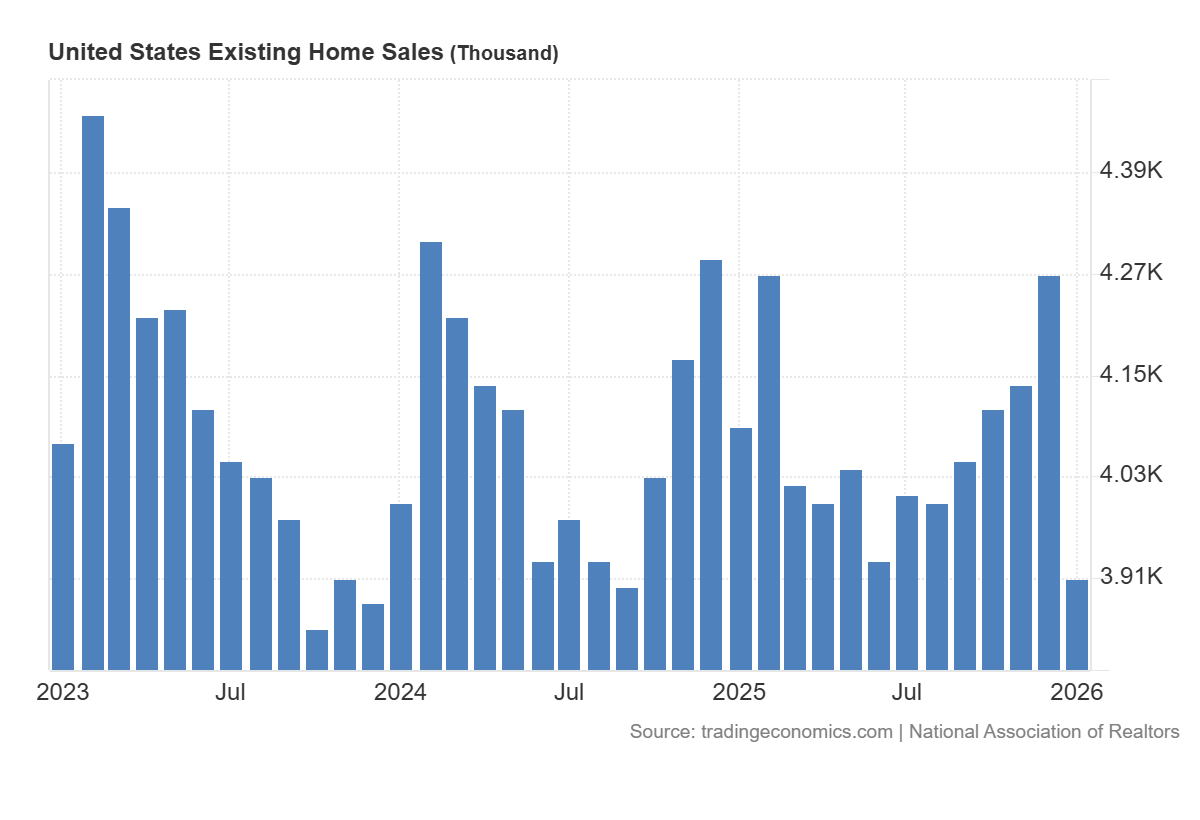
U.S. existing-home sales fell -8.4% MoM in January to a 3.91M SAAR and declined -4.4% YoY, reflecting broad-based weakness despite improved affordability.
-
Total housing inventory slipped -0.8% MoM to 1.22M units but rose +3.4% YoY, with months’ supply at 3.7 (up from 3.5 in December and one year ago), indicating slightly more availability than a year earlier but still relatively tight supply.
-
The median existing-home price increased +0.9% YoY to $396,800, marking the 31st consecutive YoY gain and a new January high, consistent with ongoing price resilience amid limited supply.
-
The Housing Affordability Index rose to 116.5 (from 111.6 in December and 102.0 YoY), improving for a seventh straight month, with gains across all regions led by the West (+17.1%) and South (+15.2%).
-
Single-family sales fell -9.0% MoM to 3.53M SAAR and -4.3% YoY, while the median single-family price rose +0.6% YoY to $400,300, showing softer volumes alongside modest price growth.
-
Condo and co-op sales declined -2.6% MoM to 380k SAAR and -5.0% YoY, with the median price up +3.8% YoY to $364,600, indicating stronger annual price appreciation than single-family despite weaker sales.
-
All regions posted MoM and YoY sales declines, with the West -10.3% MoM (-7.9% YoY) and the South -9.0% MoM (-1.6% YoY), while the Northeast saw prices rise +5.8% YoY to $505,400 and the West recorded a -1.4% YoY price decline.
-
The median time on market rose to 46 days (from 39 in December and 41 YoY), suggesting slightly slower turnover, while first-time buyers accounted for 31% of sales (up from 29% MoM and 28% YoY).
-
The average 30-year fixed mortgage rate declined to 6.10% (from 6.19% in December and 6.96% YoY), aligning with improved affordability conditions even as sales volumes contracted.