
US Existing Home Sales: October 2025
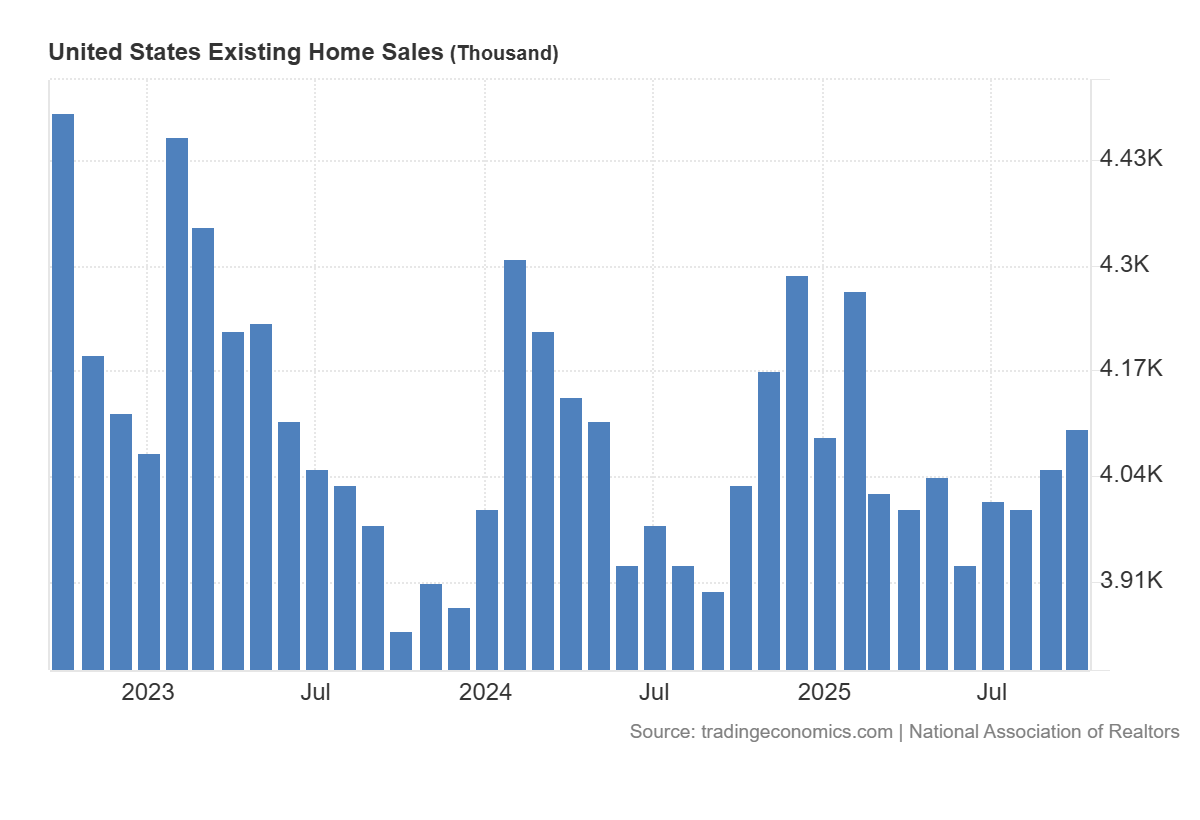
U.S. existing-home sales rose +1.2% MoM in October to a 4.10M SAAR (vs 4.08M SAAR expected), while sales increased +1.7% YoY. This is the fastest monthly sales pace since February.
-
Total housing inventory declined -0.7% MoM to 1.52M units, though levels were +10.9% YoY, and months’ supply eased to 4.4 months (from 4.5), indicating slightly tighter conditions than in September.
-
The median existing-home price rose +2.1% YoY to $415,200, marking the 28th straight month of annual price gains.
-
Single-family sales rose +0.8% MoM to 3.71M SAAR (+1.9% YoY), with the median price up +2.2% YoY to $420,600.
-
Condo/co-op sales increased +5.4% MoM to 390k SAAR (flat YoY), while the median price rose +0.9% YoY to $363,700.
-
Regionally, sales were unchanged in the Northeast, up in the Midwest (+5.3% MoM) and South (+0.5%), and down in the West (-1.3% MoM); YoY, only the West posted a decline (-2.6%).
-
Homes spent a median of 34 days on market (33 in September; 29 last year), showing a slight lengthening of selling times.
-
First-time buyers accounted for 32% of purchases (up from 27% a year ago), while cash buyers made up 29% of transactions.
-
The average 30-year mortgage rate fell to 6.25% (from 6.35% in September and 6.43% one year earlier), providing modest financing relief.