
US Existing Home Sales: November 2025
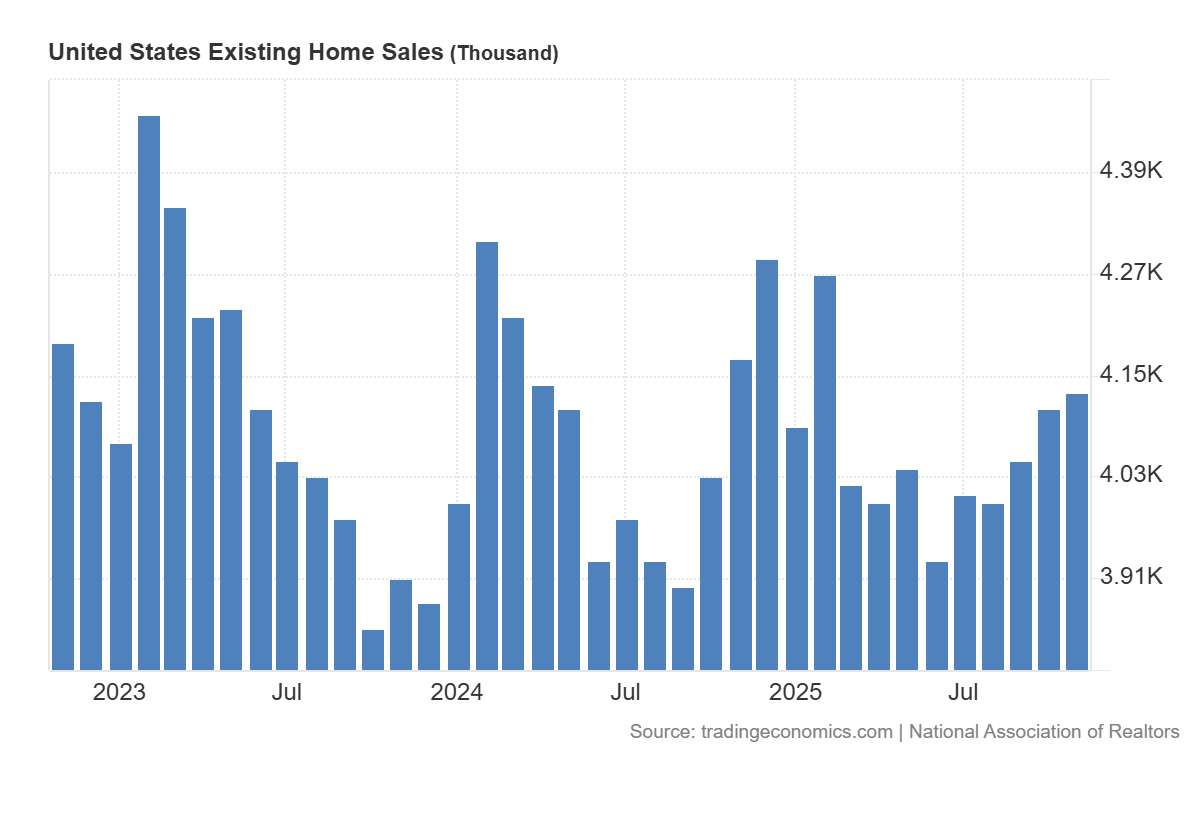
U.S. existing-home sales rose +0.5% MoM in November to a 4.13 million (vs 4.2 million expected) SAAR while falling -1.0% YoY, extending a modest late-year recovery.
-
Total housing inventory declined -5.9% MoM to 1.43M units but was up +7.5% YoY, with months’ supply easing to 4.2 months (from 4.4), indicating slightly tighter near-term conditions despite higher annual stock.
-
The median existing-home price increased +1.2% YoY to $409,200, moderating from a +2.1% YoY increase in October.
-
Single-family home sales rose +0.8% MoM to 3.75M SAAR but were down -0.8% YoY; the median price increased +1.2% YoY to $414,300, showing continued outperformance versus condos.
-
Condominium and co-op sales fell -2.6% MoM and -2.6% YoY to 380k SAAR, with the median price up just +0.1% YoY to $358,600.
-
Regionally, sales increased MoM in the Northeast (+4.1%) and South (+1.1%), declined in the Midwest (-2.0%), and were unchanged in the West; YoY, the Midwest (-3.0%) and West (-1.3%) remained weaker.
-
Homes spent a median of 36 days on the market (vs 34 days in October and 32 days a year earlier), indicating a gradual lengthening of selling times.
-
First-time buyers accounted for 30% of purchases (unchanged YoY), cash buyers represented 27% (down from 29% MoM), and investors or second-home buyers rose to 18% (from 16% MoM).
-
The average 30-year fixed mortgage rate fell to 6.24% in November (from 6.25% in October and 6.81% one year earlier), providing incremental financing relief.