


US Employment Situation: July 2025
Establishment Data
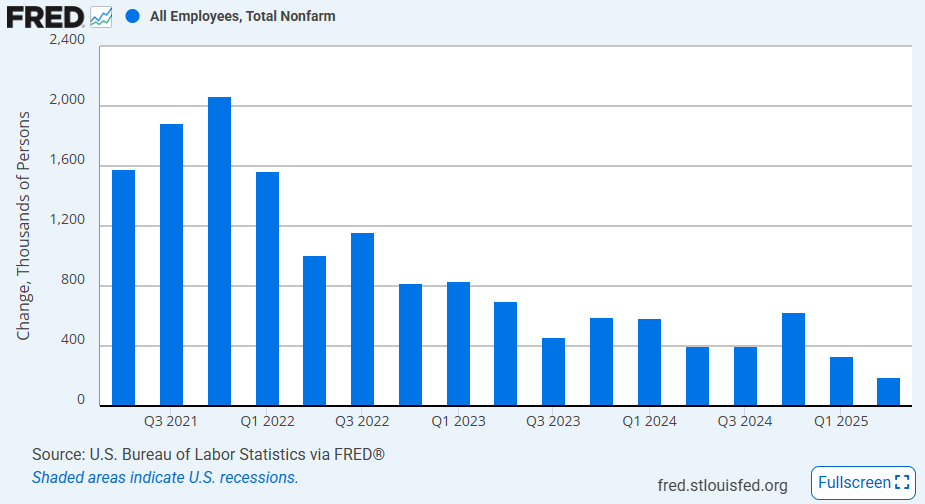
US nonfarm payroll employment growth was just 73,000 in July, falling short of expectations of a gain of 110,000 jobs. This would have been the weakest payroll growth since October 2024, but there were massive revisions made to previous months. Specifically, the BLS reported May and June employment growth at just 19,000 (down from 144,000) and 14,000 (down from 147,000), respectively. This means that 258,000 jobs were lost to revisions. With the revisions, Q2 2025 employment growth drops to just 191,000, the lowest since the mass job losses during the pandemic and before that, the lowest since Q3 2010.
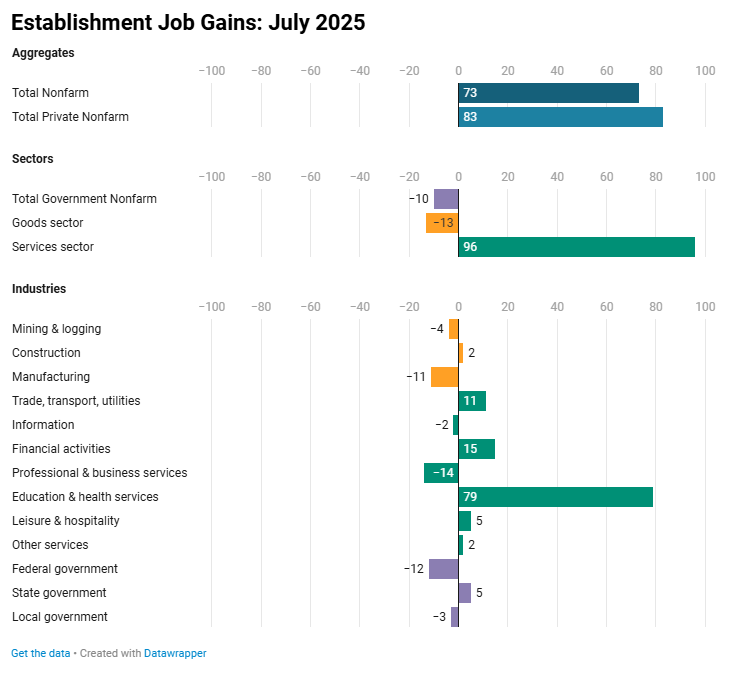
The details in the Establishment Survey show that the DOGE cuts to the federal workforce are finally starting to work their way into employment data. Government employment growth actually was a heavy weight on the headline job gains number over the last three months. In July, the public sector reported employment down -10,000, including federal government employment down -12,000. In May and June, gains in government payrolls of 7,000 and 73,000 were revised down to a decline of -50,000 and a weak 11,000 gain, respectively. As of the June report, the BLS was overreporting government payrolls by 119,000 in Q2 (June report showed 105,000 job gain, July report revised that down to -14,000 job loss).
Private payroll employment was a bit healthier in July, rising by 83,000, but it was not safe from the downward revisions. May private payroll growth was revised down from 137,000 to 69,000, and June private payroll growth was revised down from 74,000 to just 3,000. In total, a loss of 139,000 jobs to revisions. In terms of industries last month, only one stuck out as seeing healthy job gains, education & health services with employment growth of 79,000. No other industry had over 15,000 jobs added. Notably, the goods sector saw jobs down for the third straight month, down -13,000 in July, with the manufacturing industry also seeing jobs down for three months, down -11,000 in July.
The updated Establishment data is a massive reframing of where labor demand was at in the second quarter of this year. We are finally seeing the full force of the DOGE workforce reduction measures in the data. The view of the goods sector in Q2 has shifted from no employment growth to gradual job losses, suggesting tariffs are causing manufacturers to cut labor costs as nonlabor costs rise. The momentum in the labor market is only being held up by the services sector which itself is being propped up by employment growth in health care and social services.
Household Data
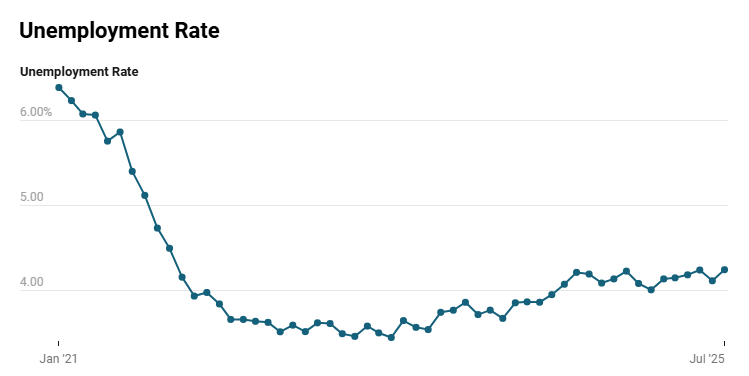
As the Establishment data presents a dismal view of labor demand in July, the Household data also weakened. The unemployment rate ticked up 0.1 ppts to 4.2%, as analysts largely expected. When looking at the rate more precisely, it actually came very close to reading at 4.3%. The June jobless rate to three decimals was 4.117% (rounding to 4.1%), and the July rate was up 13 bps to 4.247%, just 0.3 bps from rounding to 4.3%. All this is to say that the rise in the unemployment rate looks a bit more significant with more precision. Indeed, the unemployment rate rounded to two decimals, 4.25%, is the highest since October 2021.
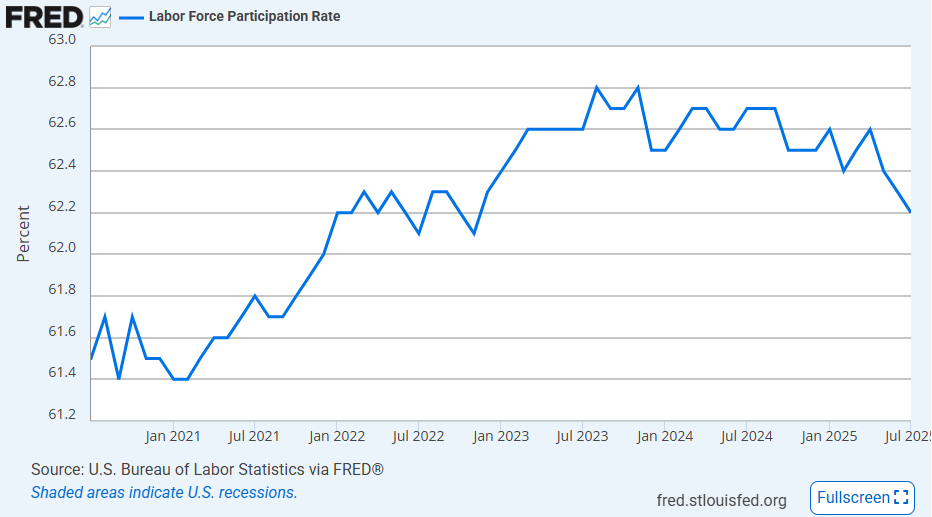
The unemployment rate increased as the number of unemployed individuals increased, up 221,000, and the number of employed individuals decreased, -260,000. The change in the labor force was mostly benign, but the labor force participation rate officially fell -0.1 ppts to 62.2% in July which is also down by -0.5 ppts YoY and the lowest since November 2022. There was a notable increase in the unemployment rate for teenagers up 0.8 ppts to 15.2%, which might coincide with the large increase of new labor force entrants who could not find a job (+275,000). At the same time, there were significant increases in the longer-term unemployed populations in July: 15 to 26 weeks unemployed up 104,000 and 27 week and over up 179,000. Typically, rises in long duration unemployment is a signal of weak hiring demand in the labor market.
Average Hourly Earnings
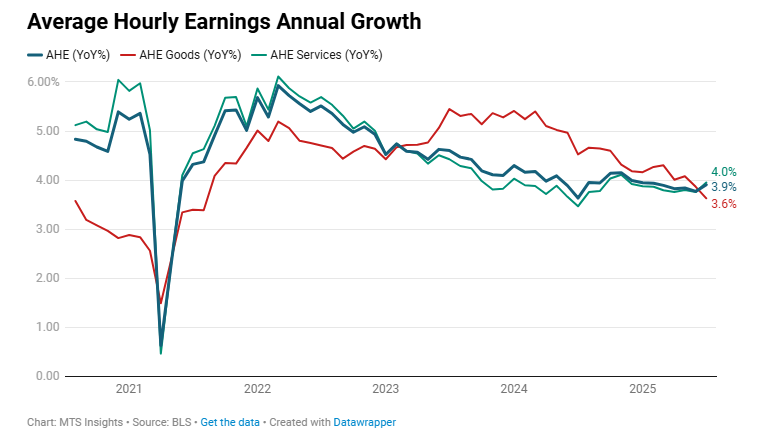
While trends in hiring softened, the July employment data featured a slight pick up in wage growth. Specifically, average hourly earnings increased 0.3% MoM and 3.9% YoY, accelerating from 3.8% YoY in June. Most of the wage growth was driven by the services sector where earnings were up 0.3% MoM and 4.0% YoY, up from 3.8% YoY, while goods sector wage growth was much tamer, up just 0.1% MoM and 3.6% YoY, down from 3.9% YoY. The dynamics in wage growth are similar to the details of the Establishment data where service sector employment growth is making up for job losses in the goods sector. It also reflects the stages of tariffs impacting businesses. Goods firms will be hit first before services firms eventually feel the pain as well. When that finally occurs, broad wage growth should weaken as businesses try to preserve margins by reducing labor input costs.