
 US Employment Situation
- Source
- BLS
- Source Link
- https://www.bls.gov/
- Frequency
- Monthly
- Next Release(s)
- May 8th, 2026 8:30 AM
-
June 5th, 2026 8:30 AM
-
July 2nd, 2026 8:30 AM
-
August 7th, 2026 8:30 AM
-
September 4th, 2026 8:30 AM
-
October 2nd, 2026 8:30 AM
-
November 6th, 2026 8:30 AM
-
December 4th, 2026 8:30 AM
Latest Updates
-
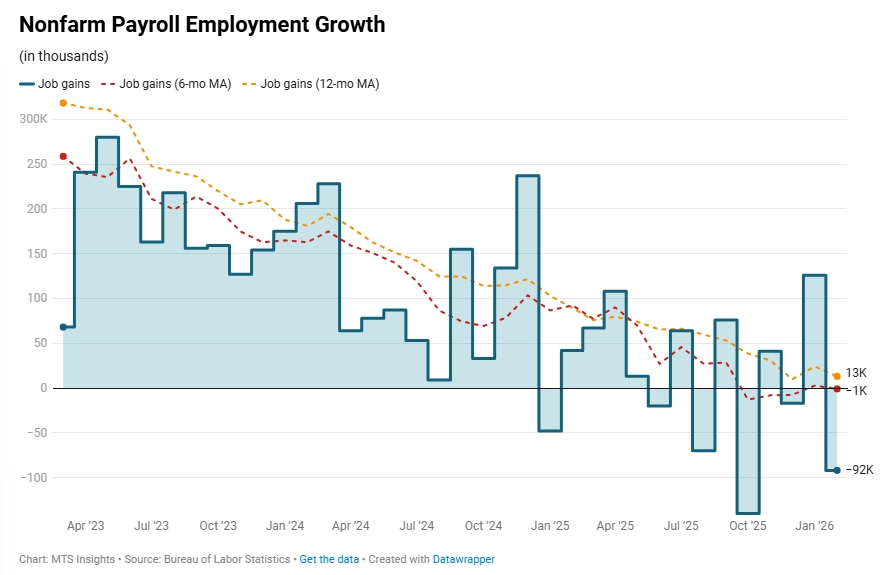
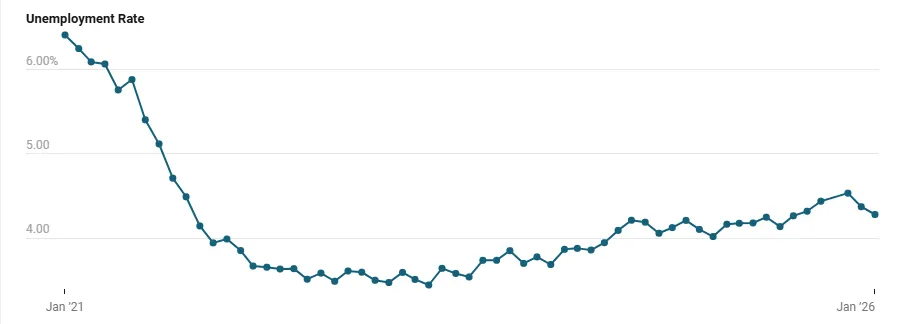
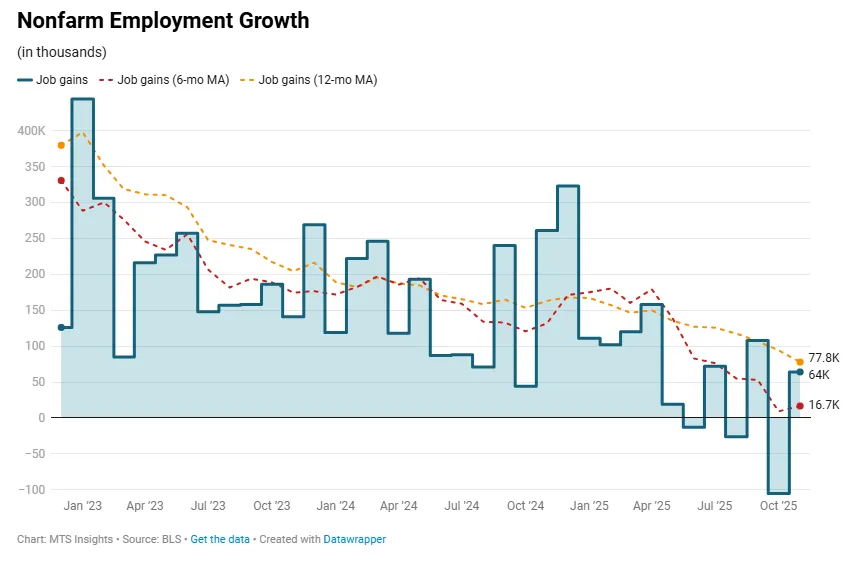
U.S. nonfarm payroll employment fell -92,000 in February while the unemployment rate rose +0.1 ppt to 4.4%, signaling a clear slowdown in labor market momentum after stronger hiring earlier in the year.
-
Nonfarm payrolls declined -92,000 in February versus expectations for +59,000, marking the worst monthly job loss since October 2025 (-140,000) and the second weakest reading since December 2020.
-
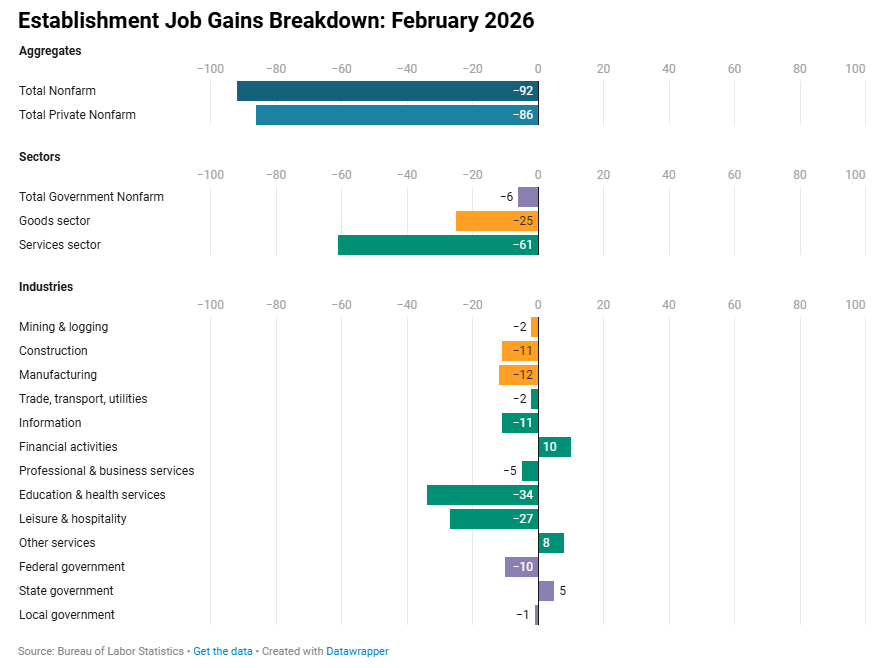
Private sector employment fell -86,000, the largest decline since December 2020, with job losses occurring across most industries.
-
Goods-producing employment declined -25,000 in February, including construction (-11,000) and manufacturing (-12,000), bringing total goods sector job growth over the past three months to -5,000.
-
Services employment dropped -61,000 after rising +95,000 in January, with major declines in education & health services (-34,000), leisure & hospitality (-27,000), information (-11,000), and transportation & warehousing (-11,300).
-
A strike in physician offices reduced health care employment by -37,000; excluding this effect would raise the education & health services change to +3,000 and adjust total payroll losses to roughly -55,000.
-
Government employment declined -6,000 in February, including a -10,000 drop in federal jobs; federal employment is now down -330,000 from its October 2024 peak, a decline of more than -10%.
-
Revisions lowered prior payroll estimates by a combined -69,000, with December revised from +48,000 to -17,000 and January reduced -4,000 to +126,000.
-
The three-month average payroll gain slowed to +6,000 while the six-month average turned negative at -1,000, indicating a notable loss of hiring momentum.
-
The unemployment rate increased to 4.4% (+0.1 ppt MoM), with employment falling -185,000 and unemployment rising +203,000 while the labor force increased only +18,000.
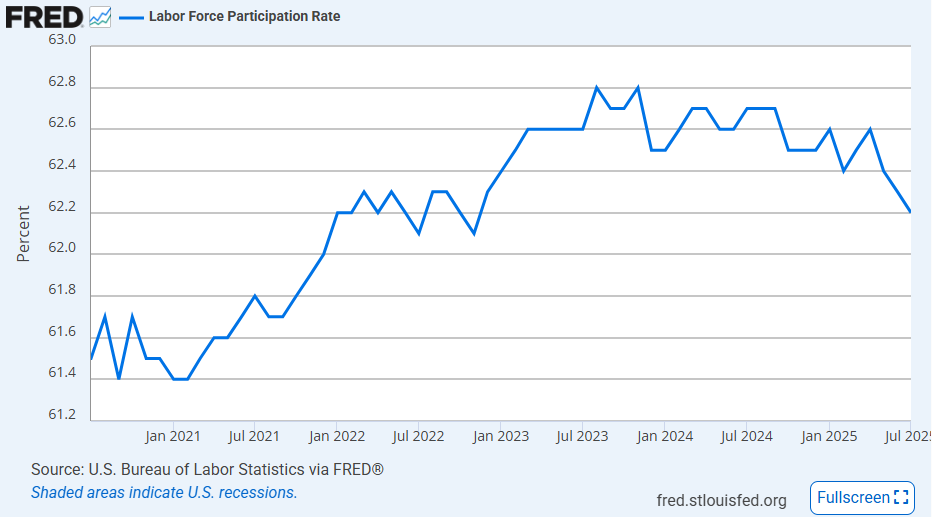
-
The labor force participation rate declined -0.1 ppt to 62.0% and the employment-population ratio fell -0.1 ppt to 59.3%, reflecting fewer individuals employed relative to the population.
-
Annual population revisions lowered both the labor force and employment levels by about -1.4 million, while leaving the unemployment rate trend largely unchanged.
-
Participation among workers aged 55+ declined to 37.3%, the lowest since 2005, while prime-age participation (25–54) remained relatively stable despite the broader demographic adjustments.
-
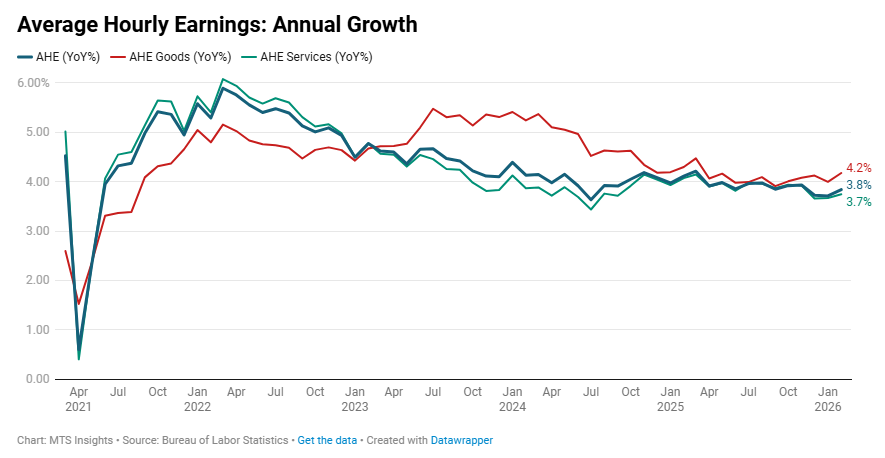
The annual growth in average hourly earnings accelerated slightly from 3.7% YoY in January to 3.8% YoY in February, with goods wage growth up to 4.2% YoY, the highest since March 2025.
-
-
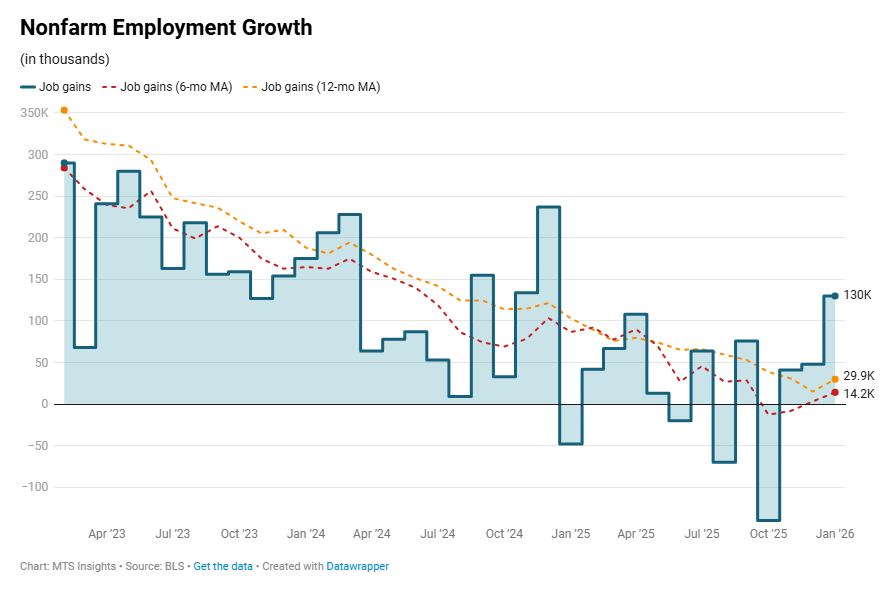
U.S. nonfarm payrolls rose +130,000 in January (vs 70,000 expected) while the unemployment rate fell -0.1 ppt to 4.3%, signaling renewed labor market stability at the start of 2026.
-
Nonfarm payrolls increased +130,000 in January, the strongest gain since April 2025, lifting the 3-month average to +73,000 after negative prints in November (-8,000) and December (-17,000), indicating a rebound in hiring momentum.
-
Private payrolls rose +172,000, offsetting a -42,000 decline in government employment; federal payrolls fell -34,000 and are now down -327,000 (-10.9%) from their October 2024 peak, showing continued public-sector drag.
-
Within private hiring, goods-producing jobs increased +36,000, led by construction (+33,000), while manufacturing added +5,000 after prior weakness; services added +136,000, with health care and social assistance contributing +123,500, underscoring concentration in one sector.
-
Annual benchmark revisions lowered March 2025 payroll levels by -898,000 SA, cutting 2025 job growth from +584,000 to +181,000, marking the weakest year since 2003 and indicating prior labor strength was overstated.
-
The unemployment rate declined to 4.3% (-0.1 ppt MoM; -0.26 ppts since November but +0.26 ppts YoY), as employment rose +528,000 and the labor force increased +387,000; both participation (62.5%) and the employment-population ratio (59.8%) rose +0.1 ppts.
-
The number of unemployed fell -141,000, long-term unemployment declined -113,000, and part-time for economic reasons dropped -453,000, pointing to improvement in broader underemployment measures.
-
Prime-age (25–54) unemployment held at 3.7% (0.0 ppts MoM), while the 25–34 cohort rose +0.5 ppts to 4.8%, and youth unemployment (16–19) fell -1.9 ppts MoM to 13.6% but remains about +2 ppts YoY, highlighting mixed age dynamics.
-
Average hourly earnings rose +0.4% MoM and +3.7% YoY (unchanged YoY), with goods wage growth easing to +4.0% YoY (from +4.2%) and services near +3.65% YoY, maintaining wage growth within the 3.5%–4.0% range.
-
-
Establishment Data
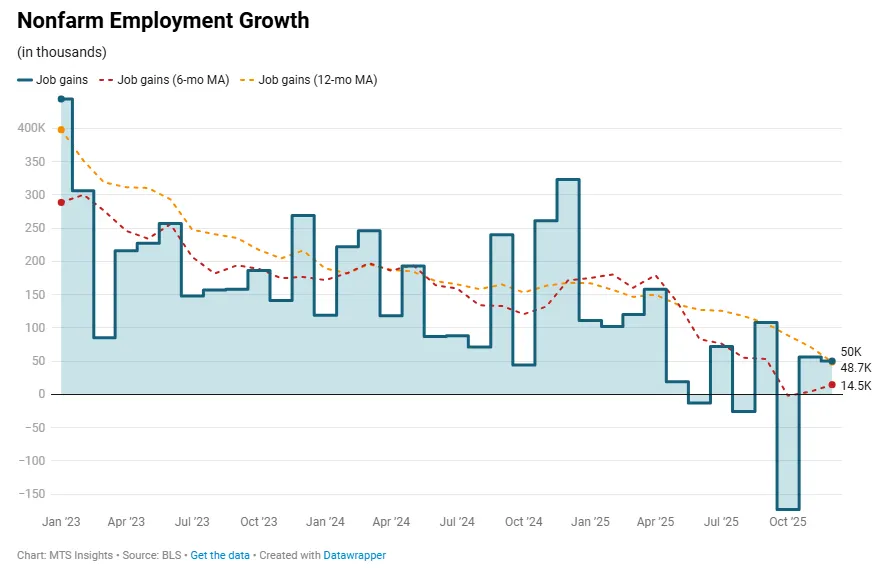
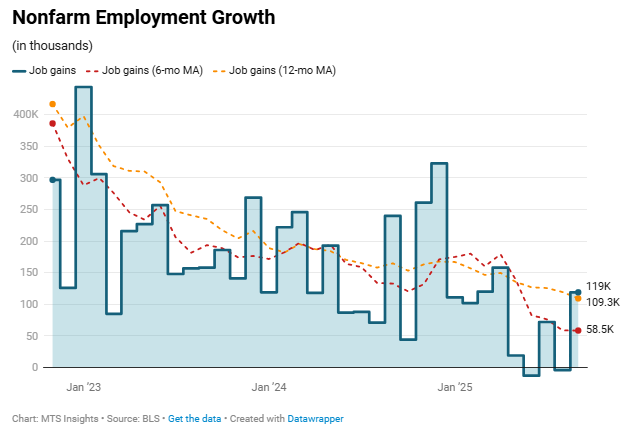
US nonfarm payroll employment increased by 50,000 in December, meaning that the year ended with low job growth. The gain was below the estimate of an increase of 60,000 and slightly below the 56,000 increase in November. Revisions of October and November data were less flattering. The October nonfarm employment decline was revised down to -173,000 (from -105,000 in the 1st estimate), and the November gain was revised down to +56,000 (from +64,000 in the 1st estimate). In total, there were -76,000 jobs lost to revisions. Indeed, the negative bias to revisions reversed the trend of a slight recovery in the 3-month average in November to job losses all throughout Q4 2025.
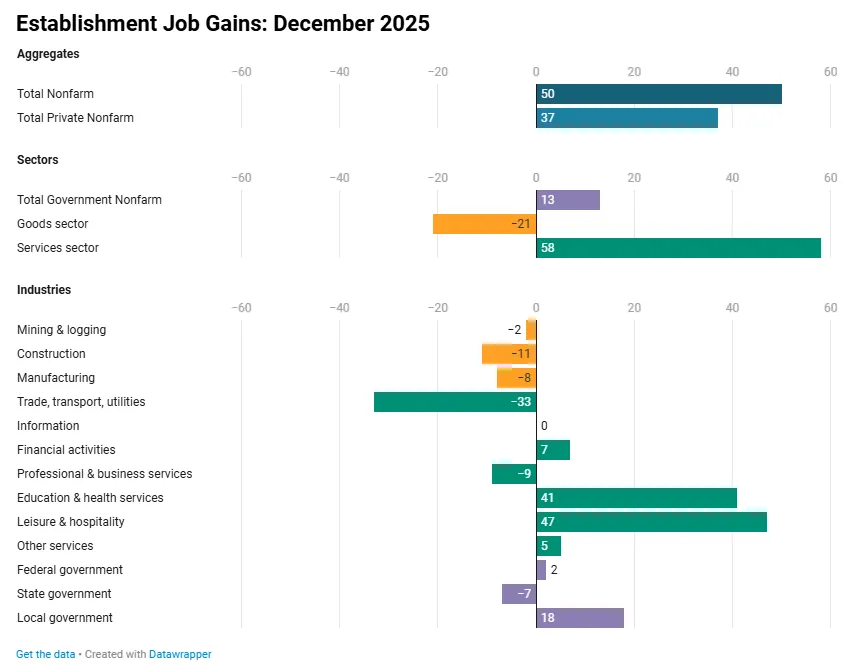
The pace of private sector hiring weakened in December, dropping to 37,000 in December after a 50,000 rise in November. This was below expectations of a 64,000 increase and slightly weaker than the ADP private employment gain of 41,000. Like the headline job growth number, private sector job gains were very affected by revisions. The October increase of 52,000 was revised down to 1,000, and the November increase of 69,000 was revised down to 50,000. This trend reduced the momentum in private hiring (measured by the 3-month average) to 29,000. well below the November print in last month’s report of 75,000. Here are some details in the industry breakdown:
- The goods sector lost -21,000 jobs in December, led by a decline of -11,000 in the construction industry. Every industry within the goods sector saw employment fall. Manufacturing employment dropped by -8,000, the eighth straight monthly decline.
- The service sector added 58,000 jobs in December, continuing to be the main source of job gains in the private sector. There was more variability in the industries, with about half losing jobs (retail trade down the most at -25,000) and about half adding jobs (leisure & hospitality added the most at +47,000). Education & health services maintained its streak of consistent solid gain, adding 41,000 in December.
- The diffusion index, measuring the balance between gaining and losing industries, was weak in December. The index for all private industries was down to 50.8, indicating that the gaining industries barely had an edge. The index for all manufacturing industries was an exceptionally weak 38.2, the lowest since May and the 3rd lowest in over five years.
Public sector employment was back to increasing in December, but not nearly enough to offset the massive October decline. The final month of the year saw government jobs up 13,000, leaving total public sector employment down -155,000 in Q4 2025 alone. This large drop can be attributed to several factors impacting federal government employment, including the government shutdown and the DOGE early retirement program. The October drop of -173,000 is only a one-time shift in government employment, and I expect it to return to increasing in 2026, albeit slowly increasing.
Overall, the Establishment data tells the story of a weak labor market in Q4 2025, but the large decline in government employment in October does obfuscate the trend a bit. Private sector employment reflects a more true picture of where the labor market is going into the new year, a slow deterioration in hiring, but no real capitulation to layoffs. This reflects the descriptions of a “no hire, no fire” employment situation in the US, described by Fed officials, including Chair Powell.
Household Data
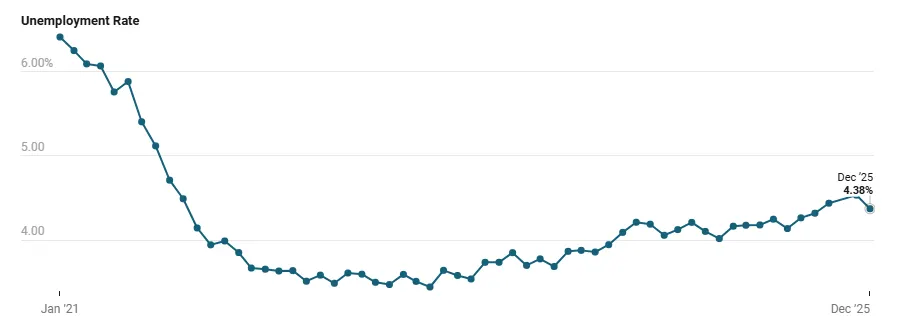
The Household data has been the more volatile, uncertain section of the jobs report due to the disruptions from the government shutdown, and now because of the seasonal adjustment refactoring in the December report. The latest data point for the unemployment rate is back below 4.40% with a December reading of 4.38%, the lowest since August 2025. This was down -16 bps from the 4.54% reading in November and below expectations of analysts’ forecast of 4.50%. It is really important to look at these numbers with 2 decimals of precision, because rounding makes the swings look more significant than they are. At that precision, the 1st estimate of the November unemployment rate of 4.6% was revised down to 4.5% due to new seasonal adjustment (when more precisely, the revision was -2 bps), and the December rate fell to 4.4% (when more precisely, the decline was -14 bps).
The takeaway from all this is that the labor market does not look as loose as it was after last month’s report. Indeed, the other segments oft he labor force flows in December all point to this. The total number of unemployed fell by -278,000, and the total number of employed increased by 232,000 (pushing the employment-population ratio up 0.1 ppts to 59.7%). The labor force shrank by -46,000, and the participation rate dropped -0.1 ppts to 62.5%. Additionally, the short-term unemployment population dropped significantly: less than 5 weeks down -251,000 and 5 to 14 weeks down -121,000. Most month-to-month statistics in this report run against the November narrative that labor market slack had increased significantly in November; however, they push back against the magnitude and not necessarily the direction.
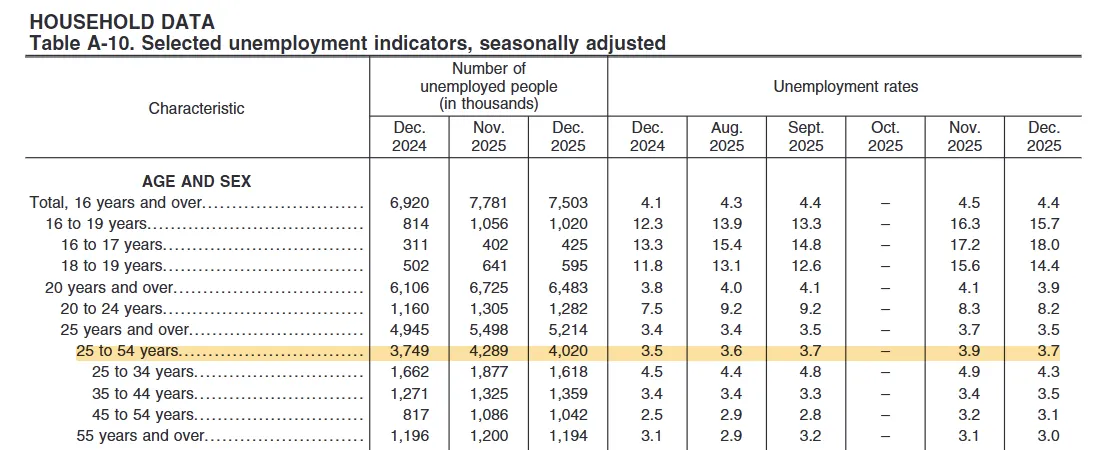
Another good example of the reversal in the narrative is the snap back in the prime age unemployment rate in December. After rising to 3.9% from September to November (the second highest in four years), the BLS reported a -0.2 ppts drop back to 3.7% in December. It’s unclear if this reflects some sort of reality in the US labor market or if the volatility is due to disruptions to data collection and statistical quirks. Regardless, it alters the narrative of accelerated labor market loosening that was developed from the November report.
Wage Growth
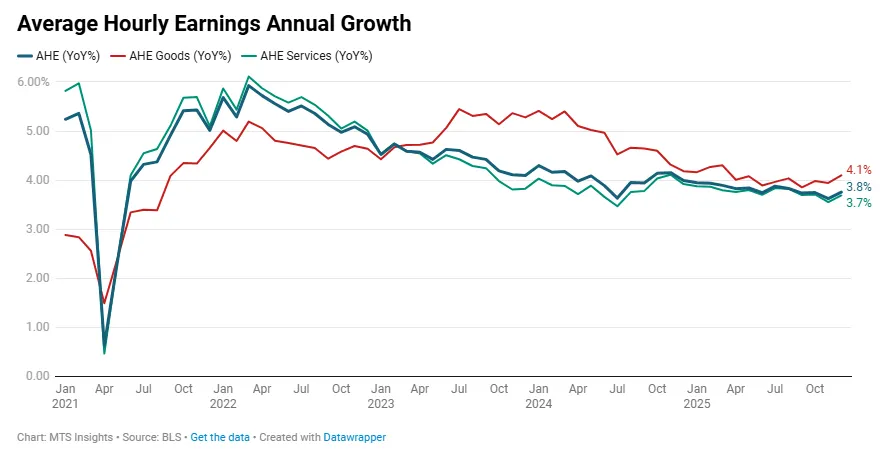
Despite signs of weakness in the hiring data from the Establishment survey, wage growth surprised to the upside. Average hourly earnings increased 0.3% MoM and 3.8% YoY in December, above the 3.6% YoY increase that was expected. This was partly due to revisions, however, as the November YoY wage growth was revised up from 3.5% YoY in the 1st estimate to 3.6% YoY in the 2nd estimate. Both the goods and services sectors saw wage growth accelerate in December, and YoY growth in average hourly earnings in the goods sector specifically accelerated to a nine-month high of 4.1%.
-
Establishment Data
The report does provide an update on the Establishment dataset for both October and November, as the data was still able to be collected despite the government shutdown. Total nonfarm payroll employment was shown to have increased by 64,000 in November, after a -105,000 drop in October. On balance, this suggests that -41,000 jobs were lost in the two-month period since September. However, the government shutdown heavily affected government payrolls. While furloughed workers were not counted as unemployed, the BLS counted any contractors or government employees who did not work/receive pay in October as unemployed. This resulted in a -157,000 decline in government payrolls.
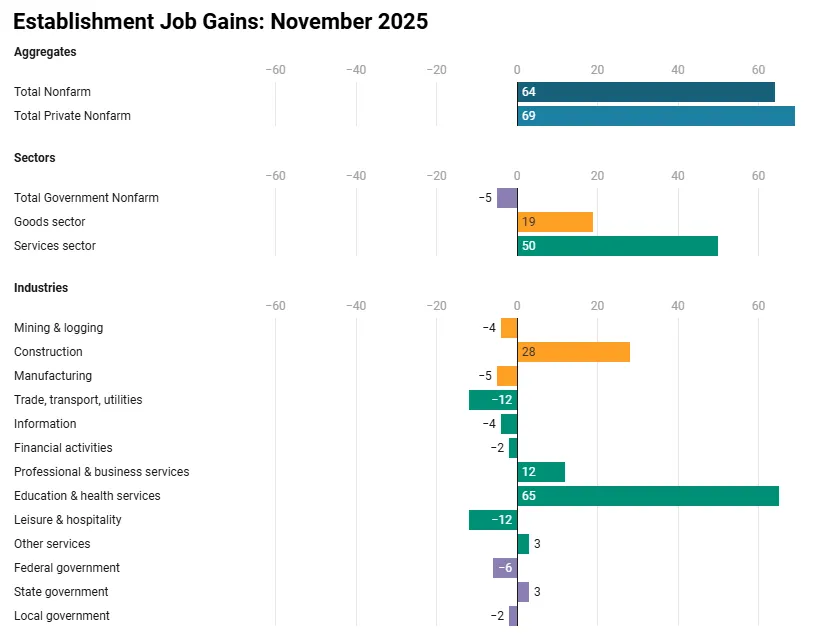
Private payroll growth tells a less volatile story. Private payrolls increased in both of the reported months, by 52,000 in October and by 69,000 in November. Notably, the November increase is above the 45,000 that was forecasted by analysts and completely different than the -32,000 reported in ADP’s National Employment Report. The stronger data point means that there was an increase in hiring momentum as the 3-month moving average of private payroll growth increased from 57,000 in September to 75,000 in November. Some notes on the industry breakdown:
- The goods sector added 19,000 jobs in November after losing -9,000 in October. Basically, all of the growth came from an increase of 28,000 in the construction industry in November. The manufacturing sector continues to see employment decline: down by -9,000 in October and by -5,000 in November.
- The services sector added 50,000 jobs in November and 61,000 jobs in October. Like in the goods sector, most of the growth across both months came from one segment, education and health services, which added 65,000 in November and 59,000 in October. That means that without this segment, service sector employment would’ve contracted in the last 2 months.
- Industries that might be positively impacted by the holiday period appeared to be in a slump. The wholesale and retail trade together only added 3,900 jobs in October and November, and the transportation & warehousing industry reported payrolls down by -18,200 in that period.
As mentioned before, government payrolls have become a bit of a confounding variable in this jobs report due to the volatility caused by the government shutdown. Government payrolls dropped -162,000 across both months, a very unusual result, but the BLS does explain some of it. Not only was the decline affected by the government shutdown, but there was also a decline in employment as a result of the DOGE deferred resignation offer for federal employees. In summary, the DOGE early retirements, disengagement of federal contractors, and temporary layoff of some government workers explain the large October drop. However, the BLS is not able to “precisely quantify” how these factors affected the data. Thus, the only real value in the Establishment data in the November report is in the private payrolls.
Household Data
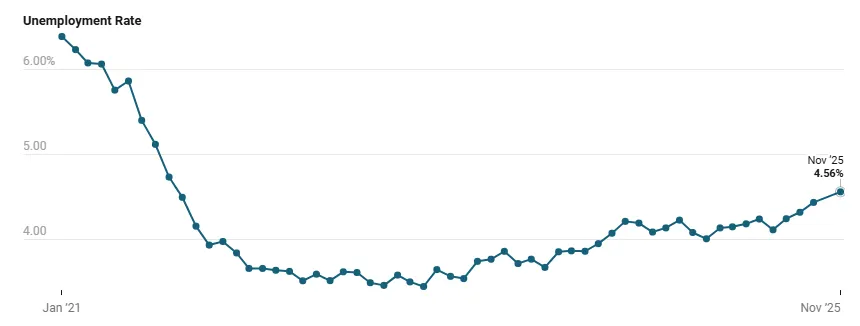
The November report does not include October data for the Household survey since it was not collected. Thus, we only have November data points to look at and 2-month deltas. The headline unemployment rate ticked up 12 bps to 4.56% from September to November, resulting in a rounded print of 4.6% (up from a rounded 4.4%). The rounded change of 0.2 ppts slightly overstates the increase in the unemployment rate, which is actually just over half that. Nevertheless, there was a material increase in joblessness after September, such that the unemployment rate is now at the highest point since September 2021.
The increase in the unemployment rate came from an increase in participation that led to a larger portion of that increase in the labor force becoming unemployed versus employed. Specifically, the labor force increased by 323,000 from September to November (participation rate up 0.1 ppts to 62.5%). The employed population increased by just 96,000 in that period (employment-population ratio down -0.1 ppt to 59.6%) while the unemployed population increased by 228,000 in the same period.
The BLS does note that the November Household survey should be interpreted with added caution, given several shutdown-related disruptions.
- October data were not collected and were not backfilled, meaning November estimates rely on a modified weighting process that shifts previously collected data forward and effectively forces analysis into two-month changes rather than standard month-to-month comparisons.
- Data collection for November began late and was extended around the Thanksgiving holiday, resulting in a lower-than-usual response rate of 64 percent and slightly higher standard errors across key series. While seasonal adjustment methods were unchanged and the reference week was otherwise typical, these factors increase statistical noise and reduce precision.
- Federal government workers were counted as employed because the government reopened before the end of the reference week, and the BLS noted that the overall impact of the shutdown on Household survey estimates cannot be precisely quantified.
Despite these caveats, the Household data are a clear indicator of weakening in the labor market, and much more convincing than the Establishment data. The increase in joblessness was seen across several age groups, including the key prime working age cohort (25 to 54 years), where the unemployment rate increased 0.2 ppts to 3.9% over the two-month period, the highest it has been since November 2024 and, before that, since November 2021. Additionally, the part-time work for economic reasons due to slack work/business conditions jumped 321,000 in the two-month period, or an average of 160,500 in each month, which would be the highest monthly increases since February. It’s unlikely this part-time series was impacted by the government shutdown since the “only could find part-time work” indicator captured a roughly 600,000 increase that was likely caused by the federal work disruption.
-
Establishment Survey
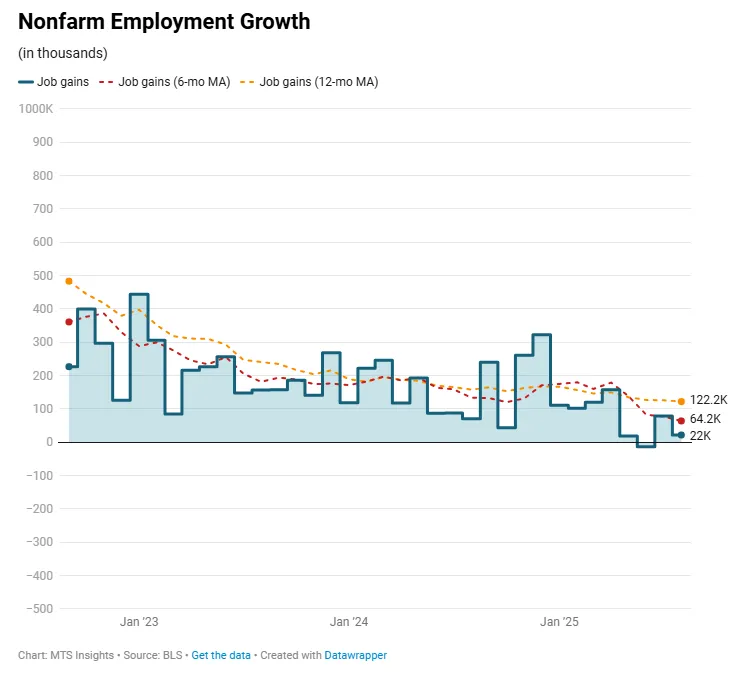
US nonfarm payroll employment increased by 119,000 in September, a surprise burst of strength exhibited by the labor market at the end of Q3. Not only was this increase above consensus expectations of a 50,000 increase, it was the largest increase since April and the third largest increase so far this year (just below March gain of 120,000). Most significantly, the strong growth in September reverses a string of weak readings that began in May and lasted through the summer, and resulted in job growth averaging around 18,500 over the course of those four months. Revisions in today’s report made those numbers look even worse as the July total was taken down -7,000 to 72,000, and the August total was revised down -26,000, such that employment fell -2,000 during the month.
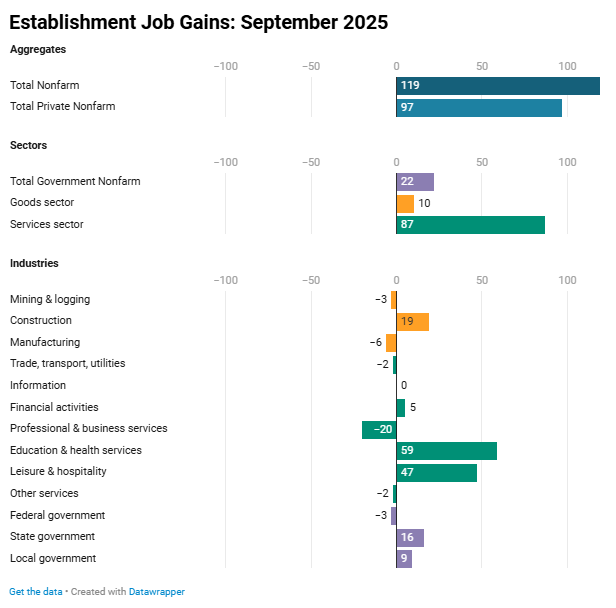
The headline number was supported by the strongest private payroll growth since April. The 97,000 jobs added by private sector firms were ahead of expectations of a 62,000 increase and substantially above the September ADP private sector employment change estimate of -29,000. As usual, the service sector provided most of the job growth, adding 87,000, while the goods sector only added 10,000. Two services industries specifically accounted for almost all of the increase in nonfarm payrolls: education and health services (+59,000) and leisure and hospitality (+47,000). Job growth in other industries was a wash. Notably, with the Trump admin’s focus on tariffs in mind, manufacturing employment fell for the 5th straight month since the reciprocal tariffs were put in place in April (down -58,000 cumulative since then).
Government job growth made a small positive contribution at +22,000. This included federal employment down -3,000, offset by 25,000 jobs added in state & local governments. This, of course, doesn’t include the job losses that may have come about as a result of the reduction in force orders during the government shutdown. Jobless claims data suggest that the number was not insignificant. Initial claims by federal employees totaled 5,719 in the week of November 8th, well above 615 in the same week a year ago.
Taken as given, the data from the Establishment survey looked pretty solid. Hiring appears to have bounced back after a weak summer, and the private sector accounted for a majority of the increase. The breadth of job gains across industries was not great, but there didn’t appear to be evidence of widespread layoffs. The one caveat is that these numbers are likely to be revised, and revisions have not been friendly.
Household Survey
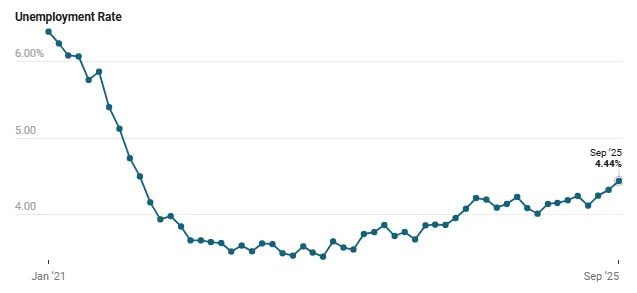
If you were optimistic reading through the Establishment survey data, this is the part of the report where things get ugly. The headline unemployment rate saw a significant increase in September, rising 13 bps to 4.44%, above expectations of it remaining at 4.3% and the highest since October 2021. This increase wasn’t a matter of rounding. The print came within 1.1 bps of rounding up to 4.5%. It sounds nitpicky to comment at this level of detail, but it is important to note these things since a majority of people view these data points as a single data point. The takeaway is that there was a solid, measurable increase in unemployment in September, confirming a clear trend that has been established this year.
The increase in the unemployment rate came from an increase in the total number of unemployed (+219,000) that resulted from a sizeable increase in the civilian labor force (+470,000). While there was an increase in the employed population (+251,000) and the employment rate (+0.1 ppts to 59.7%), the raw increase in the unemployed was just too high relative to the increase in the number of employed. Interestingly, this does contradict some Fed officials’ views on the labor market that suggest labor supply and labor demand are both going down, leading to equilibrium rather than slack.
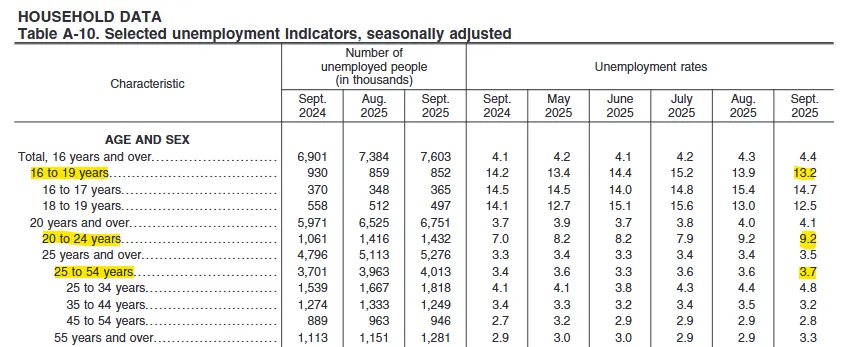
The age breakdown shows that prime-age and older workers drove the entire increase in September’s unemployment rate. The youngest cohort, 16 to 19 years, actually saw a notable decline in their jobless rate to 13.2%, and workers aged 20 to 24 held steady at 9.2%. With younger groups either improving or unchanged, the pressure came from older segments. The prime age unemployment rate rose 0.1 ppts to 3.5%, the 55 and over rate jumped 0.4 ppts to 3.3%, and early prime age workers posted the sharpest move with a 0.4 ppt increase to 4.8%. This pattern points to a weaker labor market because job losses are increasingly concentrated among core working-age adults rather than temporary or seasonal young workers, signaling more persistent underlying softness rather than noise in the data.
The Household survey data make it clear that unemployment moved meaningfully higher in September. On top of that, the increase in the labor force and in the participation rate push back against the notion that the labor market is in a sort of equilibrium state where labor supply and labor demand are both falling in tandem, such that there was nothing more than a slow cooling in the labor market.
-
US Employment Situation: October 2025 (CANCELLED)
-
Establishment Data
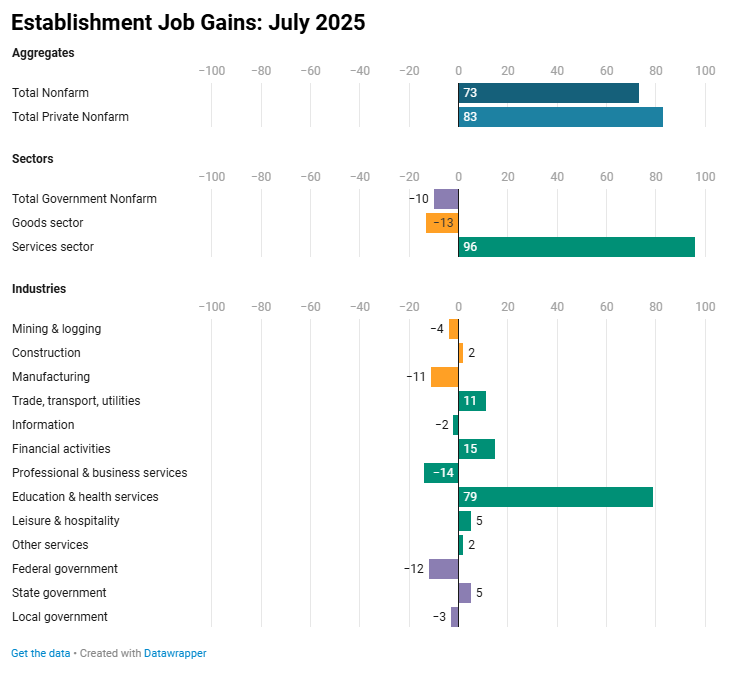
US nonfarm payroll employment came in weak again in August, increasing by just 22,000, which is a deceleration from the 79,000 jobs added in July and well below the consensus estimate of 75,000. This number looks more like the soft prints in May and June than the bounce back in July, suggesting that there is a real slowdown in hiring that can’t be ignored. With this print, the three-month average of job gains remains below 30,000 for the second straight month. The details of the report tell a similar story of the headline employment number being carried by a few industries.
The first thing to note in the details is that there was a divergence between private and public sector hiring in August. Private payrolls increased 38,000, still below expectations of around 75,000 but notably stronger than the headline number. This means that government payrolls declined by -16,000, the second largest month behind May 2025 in the last three years. The shedding of jobs in the public sector was driven by the federal government as the Trump administration’s efforts to downsize the federal workforce continue to impact the labor market. So far this year, government payrolls (federal, state, and local) have only increased by 8,000. In the same period last year, government payrolls increased by 323,000.
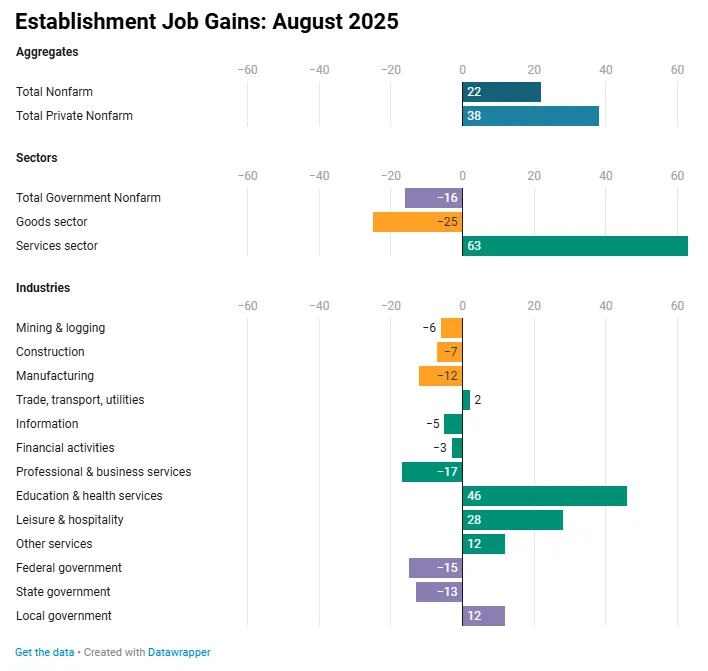
Within the private sector, hiring conditions weren’t particularly strong. The goods sector saw a decline in employment for the fourth straight month at -25,000, which is also the worst decline since October 2024 and the second worst since March 2023. All three industries tracked in the goods sector lost jobs, including the manufacturing sector (-12,000), which is also on a four-month streak of job losses. Offsetting the decline in goods sector employment was a 63,000 increase in the services sector, which looks like a solid increase, but the sector’s gains were driven primarily by two industries: education & health services (+46,000) and leisure & hospitality (+28,000). The other services industries saw job losses or no growth, including professional services (-17,000) and information (-5,000). The conclusion is one that we have seen before: payroll employment gains are being propped up by two industries, education & health services, and leisure & hospitality.
Household Data
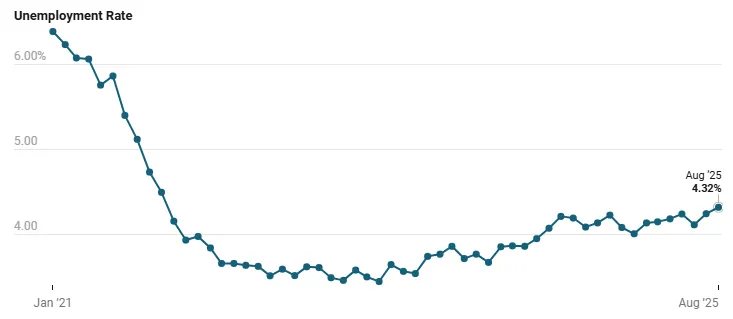
Alongside a weakening in hiring came an increase in the unemployment rate in the Household data. The unemployment rate ticked up 0.1 ppts to 4.3% in August, in line with the consensus forecast. The more precise increase in the rate was about 7.5 bps, or an increase from 4.25% to 4.32%. In terms of raw numbers, the was a 148,000 increase in the unemployed population and an even larger 288,000 increase in the over-employed population. And overall, there was a strong 436,000 increase in the labor force, which caused the labor force participation rate to tick up 0.1 ppt to 62.3%, reversing a trend of a participation rate that has been falling since April. These general statistics all suggest that the supply side of the labor market is loosening but not at an alarming rate.
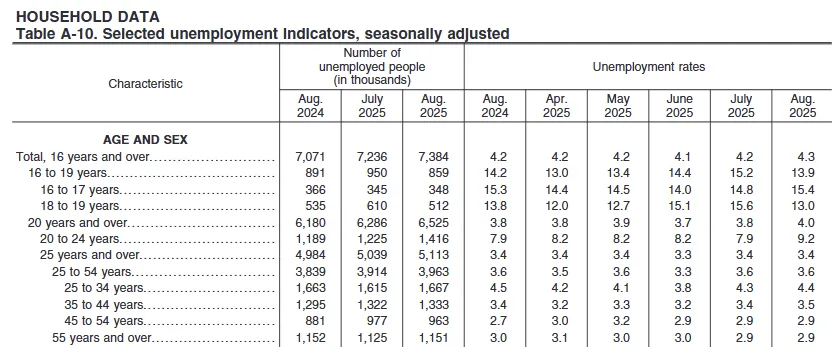
While the overall unemployment rate only saw a gradual increase, there were some interesting dynamics for certain age groups.
- The first thing to note was a -1.3 ppts drop in the unemployment rate for the 16 to 19 year old segment after spiking 1.8 ppts over the summer. While this could be tracked to changes related to the school year, this data is seasonally adjusted, so volatility like this shouldn’t happen. I hypothesize that summer employment opportunities must have been thinner than usual for that group, which resulted in the exaggerated moves.
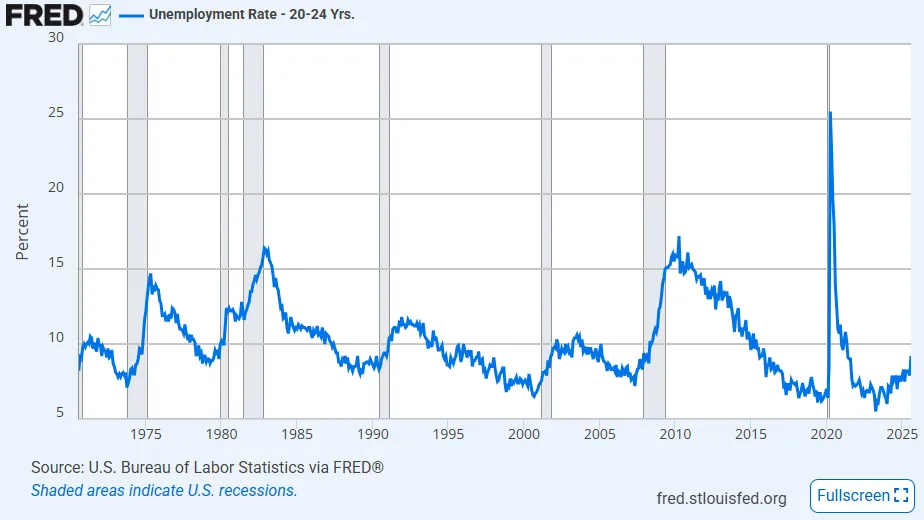
- Moving up to the next age segment, we see an even more concerning trend. The unemployment rate for 20 to 24-year-olds, correlating to individuals getting out of high school or college to join the workforce, jumped 1.3 ppts to 9.2%, the highest since May 2021. A surge in joblessness in this segment typically only happens when there is a recession coming or currently happening. However, there is a chance that this instance could be an exception since AI is increasingly encroaching on young professionals’ abilities to find an entry-level job.
- Finally, there are the prime age (25 to 54 years) and 55+ age segments, which both stand out as stronger than the two younger segments. In August, the prime age unemployment rate remained unchanged at 3.6%, even though there was an increase of about 50,000 in the raw values. The monthly trend was similar for the 55+ segment, where the unemployment rate remained at 2.9%. Most significantly, both of these segments have seen no increase in their unemployment rates in the last year, suggesting that the labor market for more skilled and established workers is actually quite solid.
These details matter because they show how broad labor market trends are playing out across different groups. In effect, there are two labor markets unfolding: one where younger workers are struggling to find jobs and falling behind in starting their careers and financial lives, and another where prime-age and older workers feel relatively secure and are not facing the same risks of layoffs. As noted earlier, weakness in younger cohorts has historically been a reliable signal of recession risk, often more telling than a small uptick, such as a 0.1 ppt increase, in the overall unemployment rate.
Wage Growth
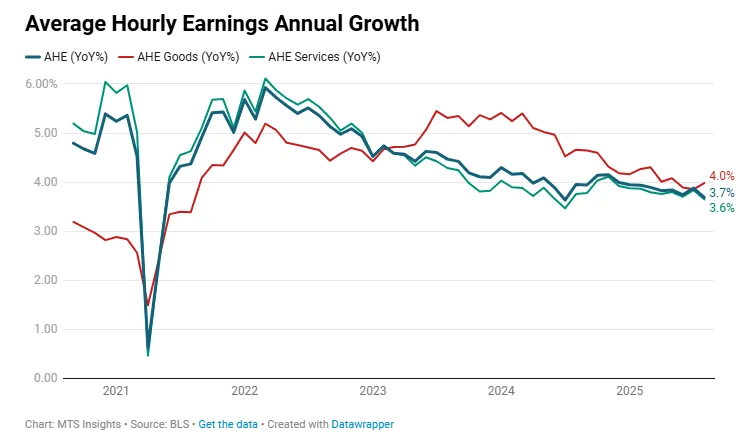
The wage growth data from the Establishment data was mostly consistent with the cooling in hiring seen in the headline job gains numbers. Average hourly earnings (AHE) increased 0.3% MoM in August, and the annual increase slowed from 3.9% YoY in July to 3.7% YoY, matching June for the lowest rate since July 2024. The cooling in wage growth came from the services sector, where AHE increased 0.3% MoM and was up 3.6% YoY (down from 3.8% YoY). This was partially offset by a 0.4% MoM increase in goods sector AHE growth, which caused the annual rate to tick back up to 4.0% YoY. Overall, wage growth does continue to be a bit sticky as it hasn’t returned to the post-pandemic lows last summer, but since it is in a gradual decline, it isn’t a focus for the Fed, which is more concerned about layoffs picking up, leading to a higher unemployment rate.
-
Establishment Data
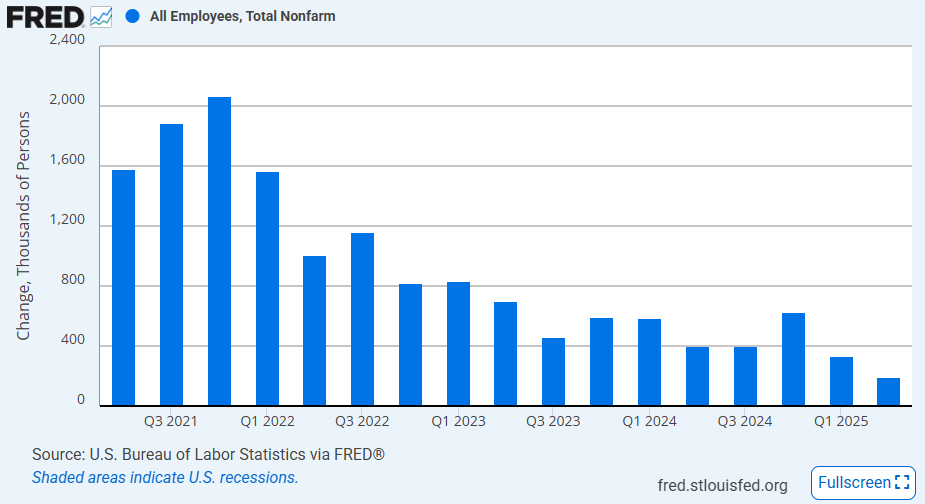
US nonfarm payroll employment growth was just 73,000 in July, falling short of expectations of a gain of 110,000 jobs. This would have been the weakest payroll growth since October 2024, but there were massive revisions made to previous months. Specifically, the BLS reported May and June employment growth at just 19,000 (down from 144,000) and 14,000 (down from 147,000), respectively. This means that 258,000 jobs were lost to revisions. With the revisions, Q2 2025 employment growth drops to just 191,000, the lowest since the mass job losses during the pandemic and before that, the lowest since Q3 2010.
The details in the Establishment Survey show that the DOGE cuts to the federal workforce are finally starting to work their way into employment data. Government employment growth actually was a heavy weight on the headline job gains number over the last three months. In July, the public sector reported employment down -10,000, including federal government employment down -12,000. In May and June, gains in government payrolls of 7,000 and 73,000 were revised down to a decline of -50,000 and a weak 11,000 gain, respectively. As of the June report, the BLS was overreporting government payrolls by 119,000 in Q2 (June report showed 105,000 job gain, July report revised that down to -14,000 job loss).
Private payroll employment was a bit healthier in July, rising by 83,000, but it was not safe from the downward revisions. May private payroll growth was revised down from 137,000 to 69,000, and June private payroll growth was revised down from 74,000 to just 3,000. In total, a loss of 139,000 jobs to revisions. In terms of industries last month, only one stuck out as seeing healthy job gains, education & health services with employment growth of 79,000. No other industry had over 15,000 jobs added. Notably, the goods sector saw jobs down for the third straight month, down -13,000 in July, with the manufacturing industry also seeing jobs down for three months, down -11,000 in July.
The updated Establishment data is a massive reframing of where labor demand was at in the second quarter of this year. We are finally seeing the full force of the DOGE workforce reduction measures in the data. The view of the goods sector in Q2 has shifted from no employment growth to gradual job losses, suggesting tariffs are causing manufacturers to cut labor costs as nonlabor costs rise. The momentum in the labor market is only being held up by the services sector which itself is being propped up by employment growth in health care and social services.
Household Data
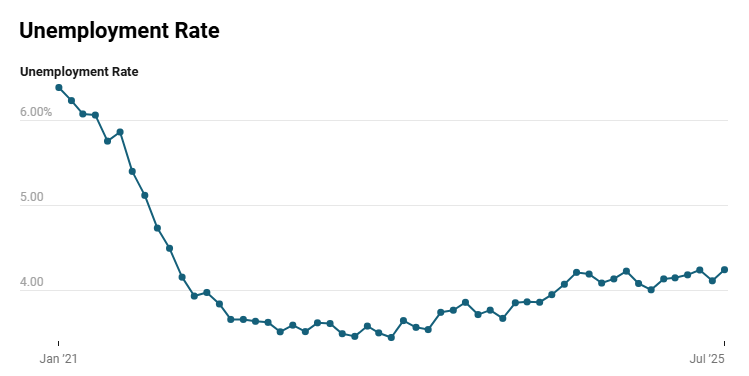
As the Establishment data presents a dismal view of labor demand in July, the Household data also weakened. The unemployment rate ticked up 0.1 ppts to 4.2%, as analysts largely expected. When looking at the rate more precisely, it actually came very close to reading at 4.3%. The June jobless rate to three decimals was 4.117% (rounding to 4.1%), and the July rate was up 13 bps to 4.247%, just 0.3 bps from rounding to 4.3%. All this is to say that the rise in the unemployment rate looks a bit more significant with more precision. Indeed, the unemployment rate rounded to two decimals, 4.25%, is the highest since October 2021.
The unemployment rate increased as the number of unemployed individuals increased, up 221,000, and the number of employed individuals decreased, -260,000. The change in the labor force was mostly benign, but the labor force participation rate officially fell -0.1 ppts to 62.2% in July which is also down by -0.5 ppts YoY and the lowest since November 2022. There was a notable increase in the unemployment rate for teenagers up 0.8 ppts to 15.2%, which might coincide with the large increase of new labor force entrants who could not find a job (+275,000). At the same time, there were significant increases in the longer-term unemployed populations in July: 15 to 26 weeks unemployed up 104,000 and 27 week and over up 179,000. Typically, rises in long duration unemployment is a signal of weak hiring demand in the labor market.
Average Hourly Earnings
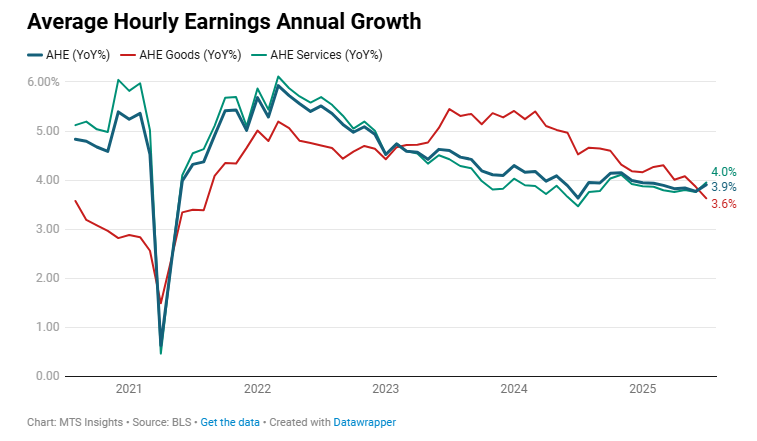
While trends in hiring softened, the July employment data featured a slight pick up in wage growth. Specifically, average hourly earnings increased 0.3% MoM and 3.9% YoY, accelerating from 3.8% YoY in June. Most of the wage growth was driven by the services sector where earnings were up 0.3% MoM and 4.0% YoY, up from 3.8% YoY, while goods sector wage growth was much tamer, up just 0.1% MoM and 3.6% YoY, down from 3.9% YoY. The dynamics in wage growth are similar to the details of the Establishment data where service sector employment growth is making up for job losses in the goods sector. It also reflects the stages of tariffs impacting businesses. Goods firms will be hit first before services firms eventually feel the pain as well. When that finally occurs, broad wage growth should weaken as businesses try to preserve margins by reducing labor input costs.
-
Establishment Data
After the ADP private payrolls miss on Wednesday, there was an ominous air surrounding the BLS report this morning. However, that just made the upside surprise in the BLS report that much more impactful for markets. The headline job gains in the BLS report came in at 147,000, beating expectations of a 110,000 increase and proving the resiliency of the US labor market. As if that wasn’t bullish enough, the BLS reported upward revisions totaling 16,000 of April and May data as opposed to the usual downward revisions. The gains in June bring some momentum back to payroll growth as it pushed the 3-month average up to 150,000,
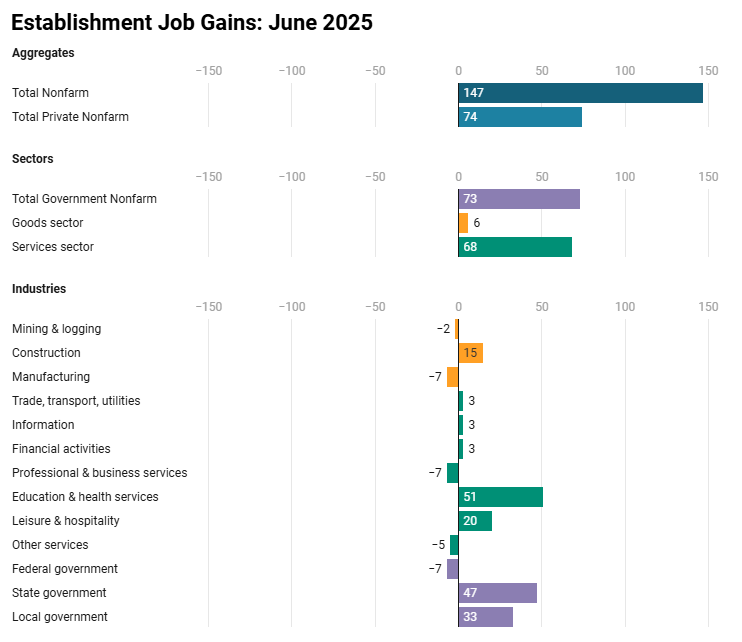
The optimism does get dulled down a bit when looking at the details of the Establishment survey. The main disappointment was that only half of the headline payroll growth came from increases in private payrolls. The increase in private payrolls of 74,000 in June is the lowest since October 2024 (but it is well above the ADP June number of -33,000). The goods sector created just 6,000 jobs while the services sector created 68,000, with almost all of the gains coming from education & health services (+51,000) and leisure & hospitality (+20,000). Similar to the ADP report, the professional & business services industry lost jobs but to a lesser degree (-7,000 in the BLS report and -56,000 in the ADP report).
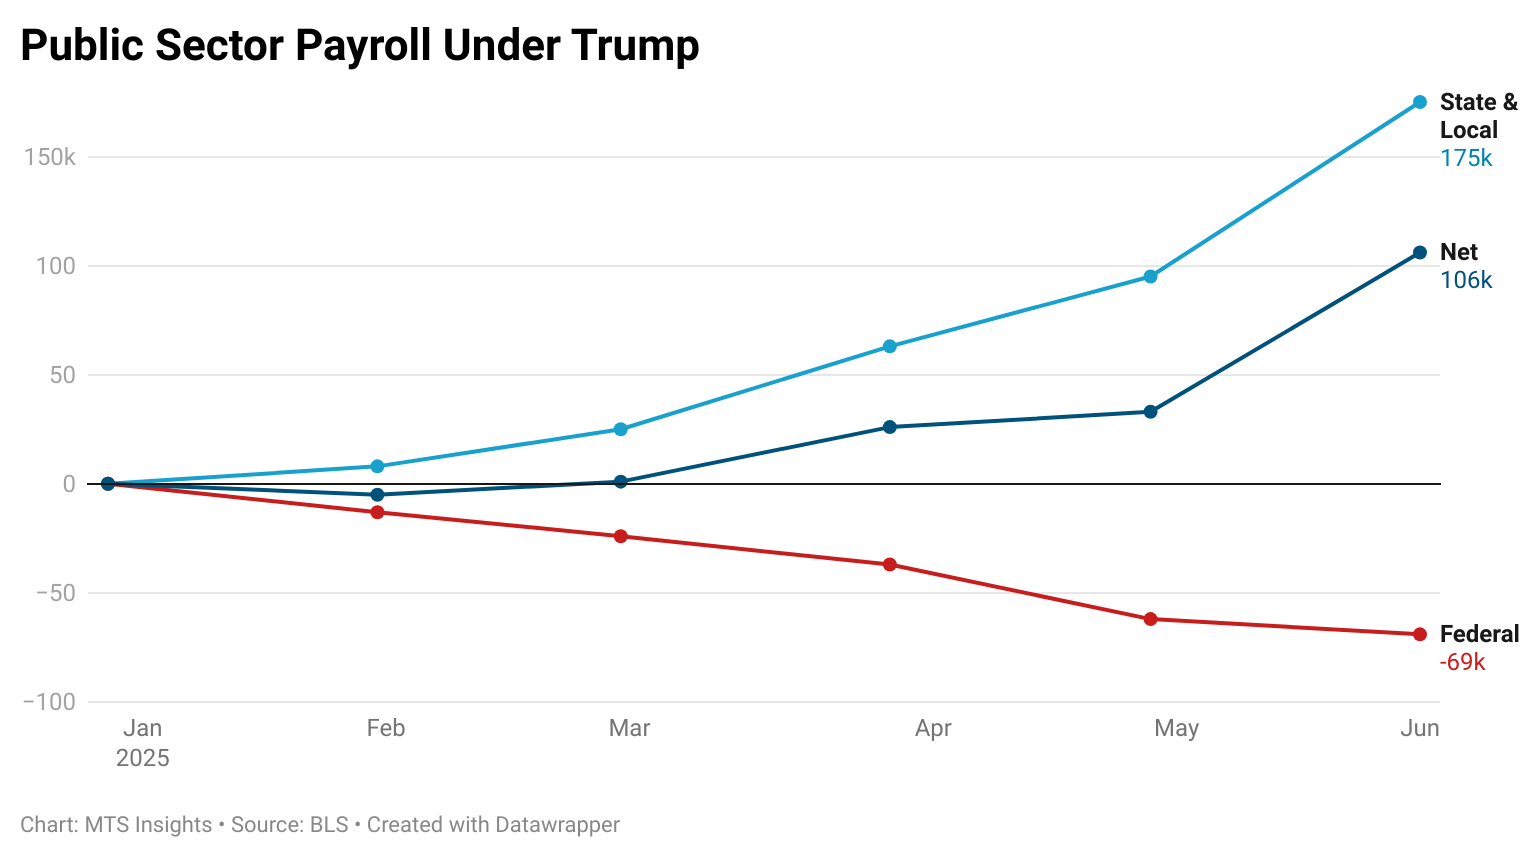
Indeed, that means that government payrolls increased 73,000, the highest one-month gain since March 2024. With the Trump administration still working to shrink the size of the federal government, federal payrolls dropped another -7,000. These losses were offset by strong hiring in state and local governments, which added 47,000 and 33,000 jobs, respectively. This trend of rising state & local payrolls and falling federal payrolls has been visible in every jobs report under Trump. In total, public sector payrolls have increased by 106,000 in the last five months, with state & local driving that gain.
After reading the details, the Establishment data does not look as strong as the headline number suggests. Private payroll growth continues to lose momentum. While the 3-month average of total nonfarm payroll growth increased, the 3-month average for private payroll growth slowed to 115,000, the lowest since October 2024 and Q3 2024, when the average dipped below 50,000 at one point. However, the numbers do feel a bit less disappointing given the ADP number that set expectations lower than what the consensus forecast for private payroll growth was. That context shifted how the market perceived and reacted to the Establishment data.
Household Data
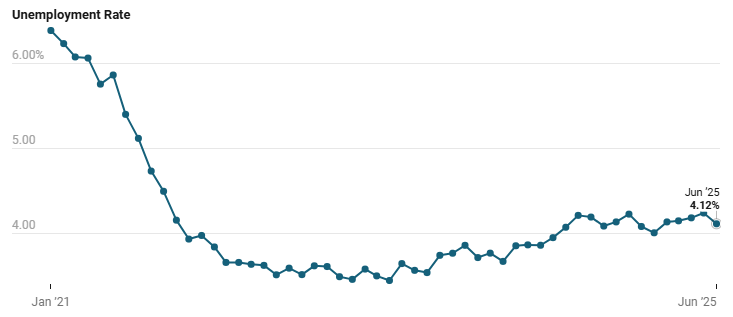
The Household data in the June jobs report was more of a bright spot than the Establishment data as the unemployment rate surprised. While the consensus forecast expected a rise in the unemployment rate, it actually fell by -12 bps to 4.12%, the lowest it has been since January. The decline in the jobless rate came from a 93,000 increase in the number of employed, and a -222,000 drop in the total number of unemployed. In addition to a drop in unemployment, labor force participation declined by -130,000 with the labor force participation rate down -0.1 ppts to 62.3%, the lowest since December 2022.
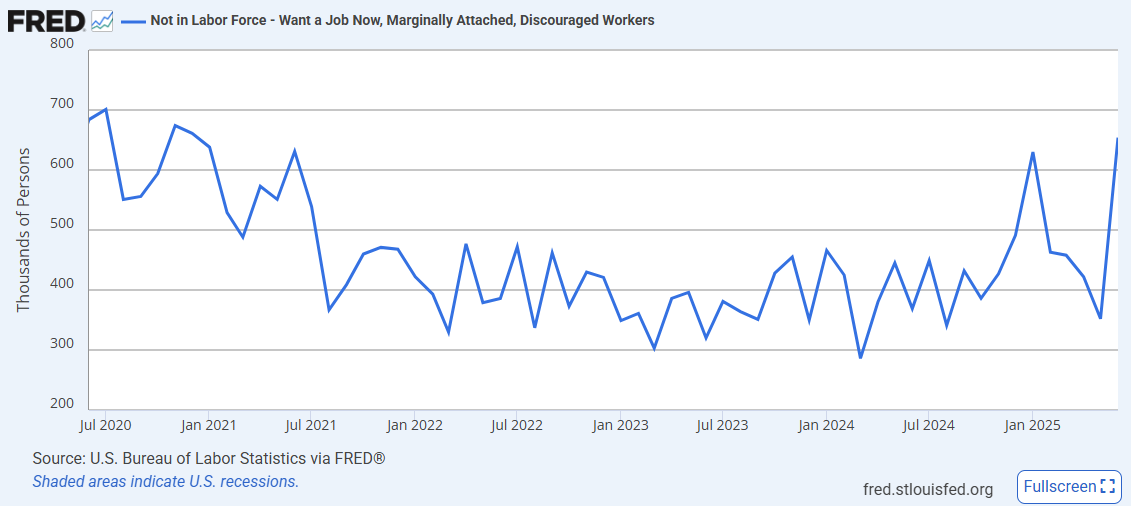
The dynamics suggest the increase in inactivity came about because some of the unemployed workers became discouraged in their job hunt. Indeed, the BLS reported a large 256,000 increase in the total number of discouraged workers which reached 637,000. That total is the highest since December 2020. When factoring discouraged workers into the unemployment rate (U-4), the rate of joblessness remained unchanged at 4.5%.
While that alternate measure of joblessness does paint the data in a different light, there are some details that are more encouraging. In the segmentation of unemployment based on reason for unemployment, the June numbers suggested that the composition of unemployment shifted towards those who left their job (+121,000 in June) than those who lost their jobs (-164,000 in June). This is consistent with an increase in the quits rate that was evident in the JOLTS data earlier this week.
Wage Growth
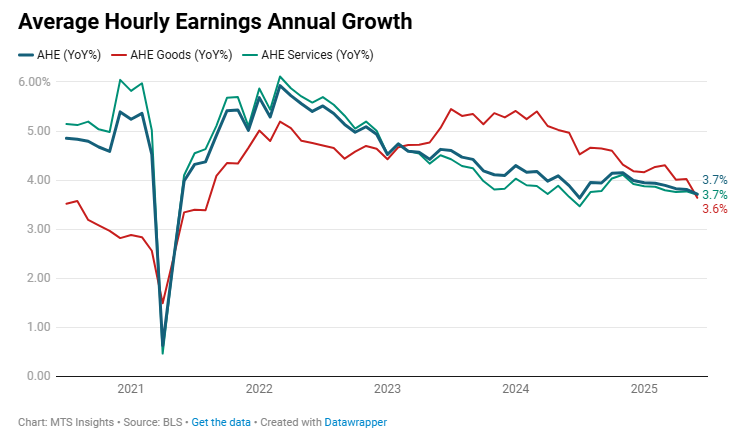
Wage growth was tepid in June across both sectors of the economy, showing evidence that inflationary pressures from labor costs continued to cool. In June, average hourly earnings increased just 0.22% MoM with goods sector wages up just 0.11% MoM and services wages up 0.22% MoM. The headline wage growth number was below expectations of a 0.3% MoM increase. The annual increase in average hourly earnings dropped to 3.7% YoY, below expectations of a 3.9% YoY increase. Goods sector annual wage growth dropped to 3.6% YoY, the lowest since August 2021, while service sector annual wage growth ticked down to 3.7% YoY, roughly where it was in Q3 2024.
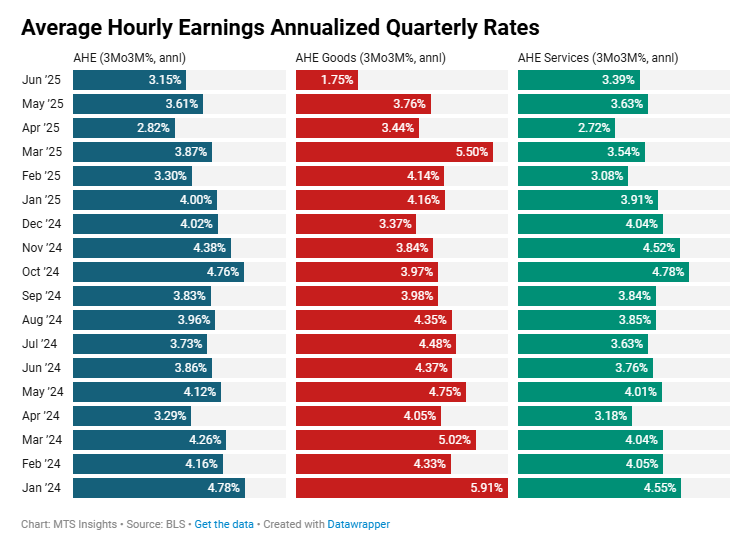
The trend in goods sector wages is actually getting a bit concerning. The annualized three-month change of hourly earnings for the goods sector has dropped to just 1.75% after trending around 3-4% earlier this year. This suggests there might be a significant divergence developing between the goods and services sector that is being hidden by the fact that the US economy is heavily services-oriented. It would not surprise me if the goods sector is nearing a recession due to tariffs and trade policy.
-
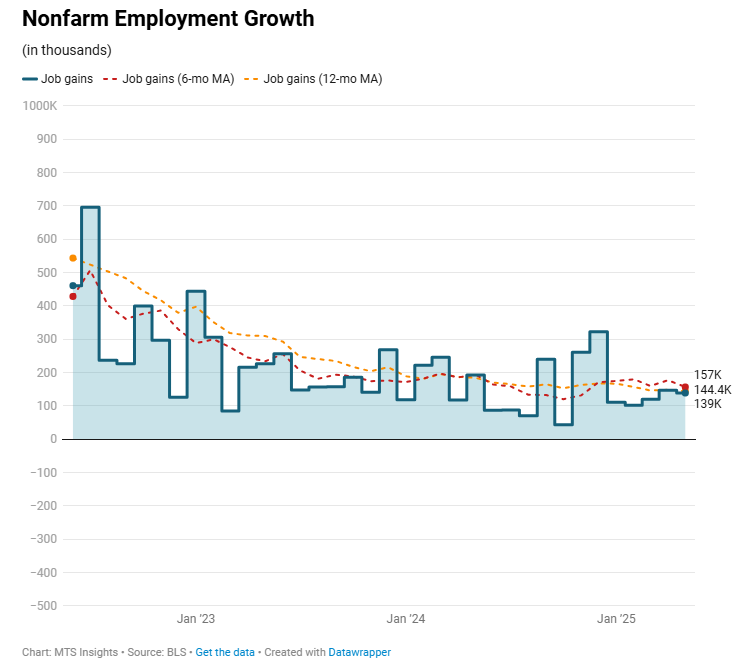
U.S. nonfarm payrolls rose by 139,000 in May (vs prior 147,000, revised down), while the unemployment rate was unchanged at 4.2%
- The labor force participation rate fell -0.2 ppts to 62.4%, and the employment-population ratio dropped -0.3 ppts to 59.7%.
- March and April payroll gains were revised down by a combined -95k, reducing recent momentum.
- Private sector job gains were led by health care (+62k), leisure & hospitality (+48k), and social assistance (+16k); federal employment fell -22k and is down -59k since January.
- Average hourly earnings rose 0.4% MoM (+$0.15) and 3.9% YoY; production and nonsupervisory earnings rose 0.4% MoM to $31.18.
- The average workweek held steady at 34.3 hours overall and 33.7 hours for production workers.
-
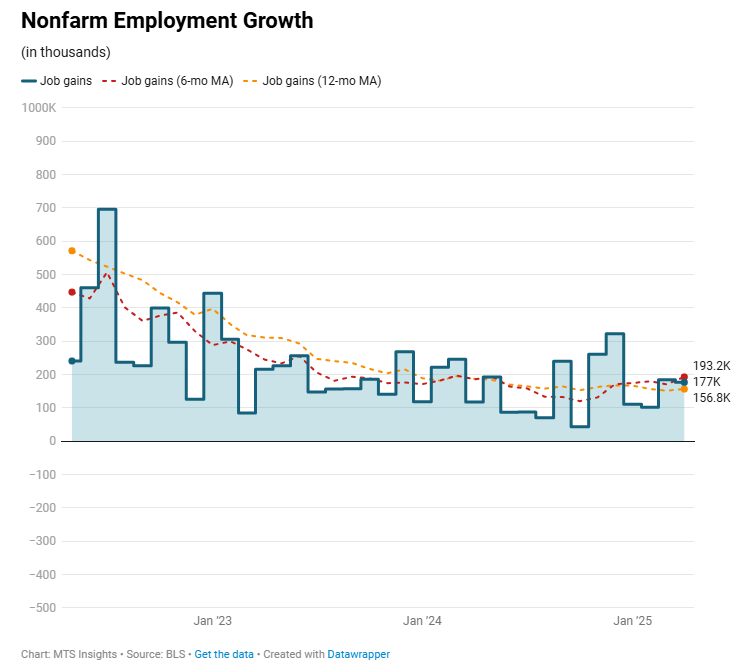
A better-than-expected April jobs report suggests that tariffs and uncertainty have not impacted the labor market yet. While there are some subtle signs of weakness, the market is taking the data in stride, factoring in slightly better growth expectations and more pauses by the Fed.
Establishment Data
The US added 177,000 jobs in April, beating expectations of a smaller increase of 130,000 and just slightly slower than the pace of employment growth in March. The last two months of job growth have been just under double the first two months of 2025, but they fall short of the strong end to 2024. While the April gain was strong, the BLS revised down February and March gains by -15,000 to 102,000 and by -43,000 to 185,000 respectively. This means that if you combine the -58,000 jobs lost to revisions with the April increase, employment growth was about in line with consensus expectations.
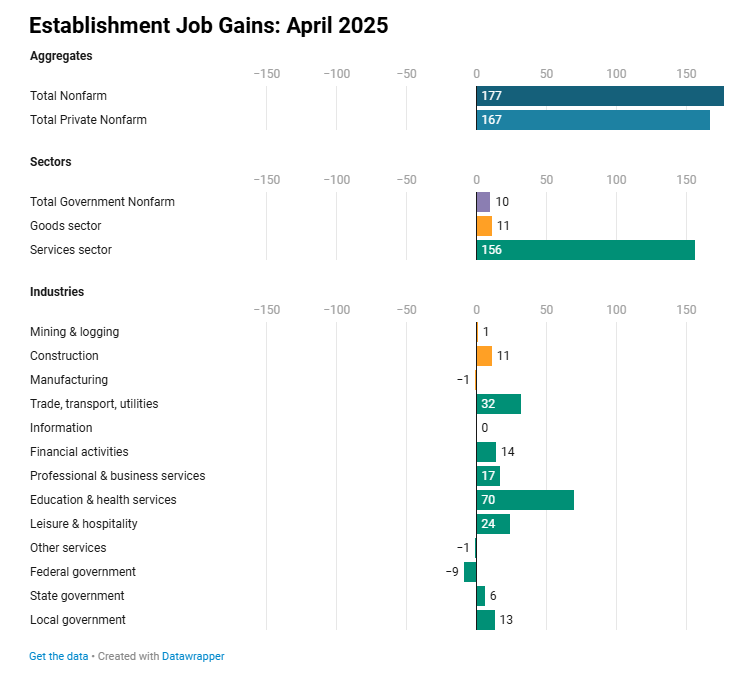
Private employment continued to take the lead in the labor market, adding 167,000 jobs in April, which was also ahead of analysts’ forecasts. The gains were concentrated in the service sector which added 156,000 jobs, led by private education & health services (+70,000) and, to a lesser extent, leisure & hospitality (+24,000). The goods sector managed a much smaller gain of 11,000 with construction leading within the sector. The manufacturing industry saw a decline of -1,000 jobs which means that it only added 2,000 in the last two months. This includes a decline of -4,700 auto manufacturing jobs in April and -1,100 jobs in March.
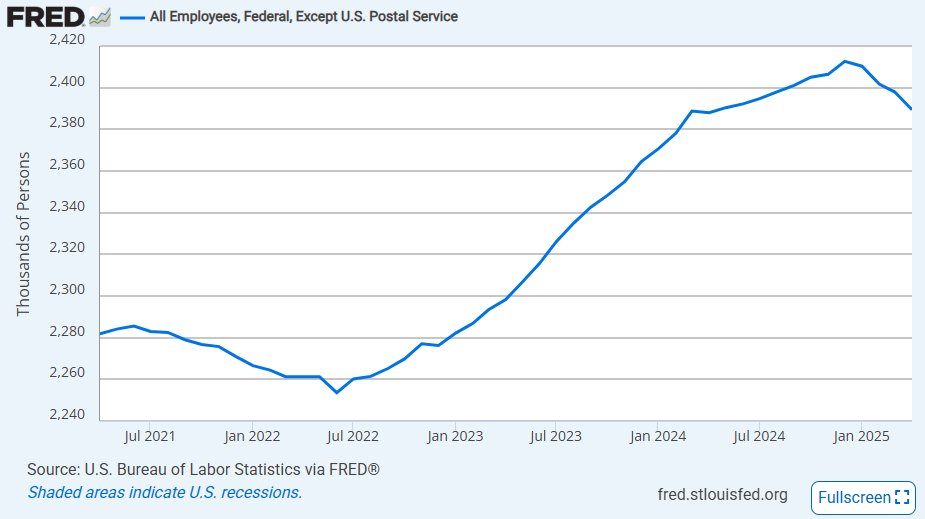
Government payroll growth was low at 10,000 in April. However, the impact of the Trump administration’s workforce cuts was apparent as the federal government reported a decline of -9,000 jobs in April. That was offset by a 13,000 increase in state & local governments. So far this year, federal government employment (excluding the US Postal Service) has fallen -23,000 to just under 2.39 million. In other words, DOGE and the Trump administration has reduced the federal workforce by about 1% in three months.
In general, the Establishment data looks generally solid as the pace of job growth over the last three months remains above 150,000 with the pace of private payroll growth just under that. There hasn’t been a broad immediate reaction to the uncertainty and confusion brought about by the tariffs and trade policies. However, there do appear to be some weak spots. The retail trade industry lost -1,800 jobs in April which could be a reaction by the industry to an impending supply crunch from elevated tariff rates. Similarly, auto manufacturing, an industry that Trump has specifically claimed to be focusing on, lost -4,700 jobs on expectations that the duties on imported auto parts will cause a surge in costs that will likely threaten demand in the coming months.
Household Data
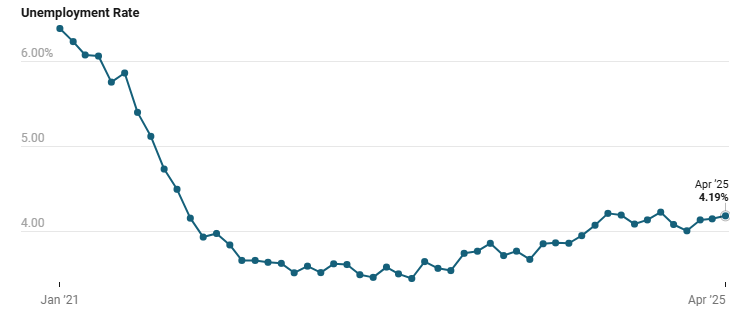
The Household Survey data reflected the solid nature of the Establishment data. Total employment surged 436,000 in April as a significant increase in participation led to those individuals finding work. At the same time, total unemployment increased by 82,000, but that wasn’t enough to see the unemployment rate tick up past 4.2%. However, the two decimal point reading of the unemployment rate did increase, rising 4 bps to 4.19% in April. Essentially, the “weak” 4.2% reading in March that resulted from rounding became a more “firm” 4.2% reading in April.
As mentioned, a strong increase in participation was observed last month with the participation rate increasing 0.1 ppts to 62.6%. Because most of the new entrants found employment, the employment ratio also ticked up 0.1 ppts, reaching 60.0%. This also resulted in a decline in workers marginally attached to the labor force (-71,000) and discouraged workers (-95,000) in April.
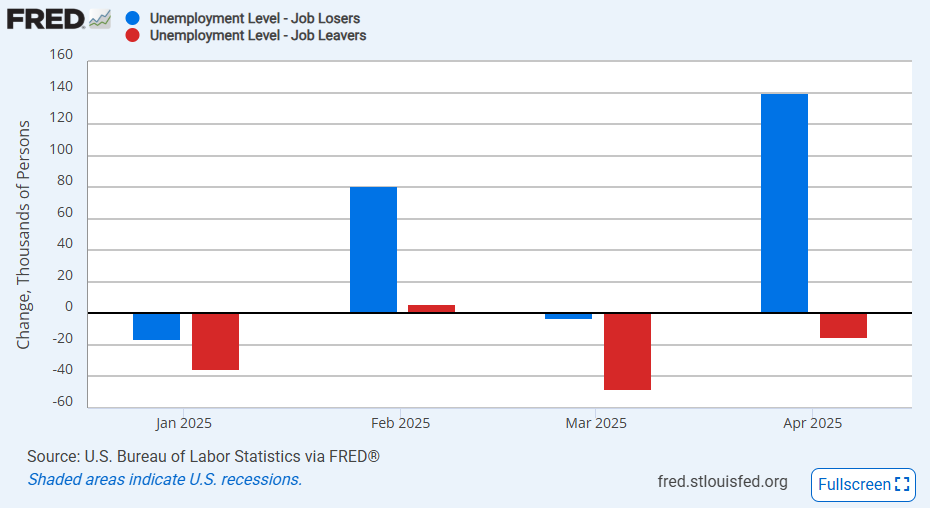
There are some details in the data that are point to some underlying weakness. The total number of individuals reporting unemployment due to losing their jobs or temp jobs (”job losers”) jumped 140,000 while those voluntarily leaving their jobs (”job leavers”) fell -15,000. So far this year, the population of “job losers” has increased 202,000 while the total number of “job leavers” is down -92,000. A labor market is typically weakening when individuals are quitting their jobs less frequently, and losing their jobs more frequently.
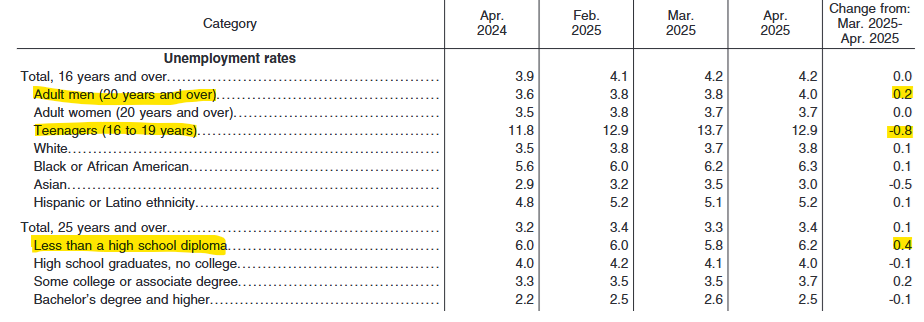
Additionally, while there was no growth in the headline unemployment rate, there were some important segments where unemployment increased. The unemployment rate for adult men, aged 20 years and over, increased 0.2 ppts to 4.0% and is up 0.4 ppts in the last year. Within the prime age workers segment, there was an increase in the unemployment rate of individuals without a high school diploma by 0.4 ppts to 6.2% which means it is now up over the last year. Offsetting these rises in unemployment was a sharp decline of -0.8 ppts in the teen unemployment rate (16-19 years old) which is typically volatile month-to-month.
Wage Growth
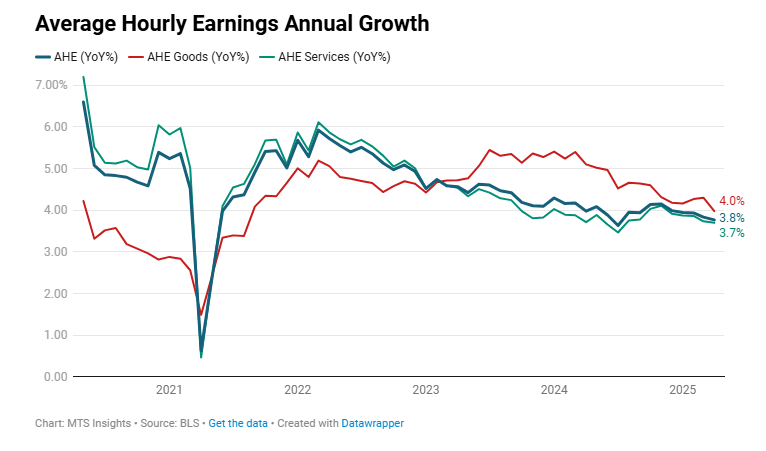
The BLS update on wage growth showed a pretty significant short-term trend of gradual easing, especially in the services sector. On an annual basis, average hourly earnings increased 3.8% YoY in April, which was unchanged from March thanks to rounding. Both goods and services wage growth slowed as well. The more interesting dynamic was in the short-term measures. The annualized 3-month growth rate of average hourly earnings was reported at just 2.59% in April, the first time its been below 3% for over a year. In the services sector, annualized 3-month wage growth was just 2.49%. If these short-term trends continue, then we will start to see a pretty significant deceleration in the longer-term annual rate which will feed into the Fed’s data. I believe this is likely to happen as firms opt to cut down on labor costs as they see their nonlabor costs rise.