
2026-05-22 · 02:00
UK Public Sector Borrowing: April 2026

UK Public Sector Borrowing
Data
Government
About
Next Release
June 19th, 2026 · 2:00 AM
-
July 21st, 2026 · 2:00 AM
-
August 21st, 2026 · 2:00 AM
-
September 22nd, 2026 · 2:00 AM
-
October 21st, 2026 · 2:00 AM
-
November 20th, 2026 · 2:00 AM
-
December 22nd, 2026 · 2:00 AM
Latest Releases
12
2026-04-23 · 02:00
UK Public Sector Borrowing: March 2026
2026-03-20 · 02:00
UK Public Sector Borrowing: February 2026
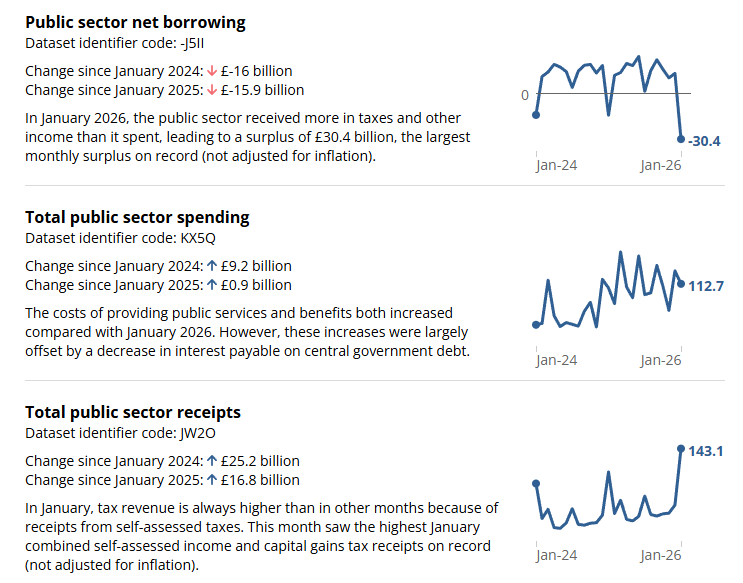
Initial estimates show that the public sector recorded a £30.4 billion surplus in January 2026, £15.9 billion higher than, or double that of January 2025, and £6.3 billion above the Office for Budget Responsibility’s November 2025 forecast; the highest surplus in any month since records began in 1993 (not adjusted for inflation).
-
In January, tax receipts are always higher than in other months, because of receipts from self-assessed taxes; combined self-assessed Income and Capital Gains Tax receipts were provisionally estimated at £46.4 billion in January 2026, £10.5 billion more than January 2025.
-
Borrowing in the financial year to January 2026 was £112.1 billion; this was £14.6 billion or 11.5% less than in the same 10-month period a year ago, but still the fifth-highest April to January borrowing on record (not adjusted for inflation).
-
Borrowing in the financial year to January 2026 was provisionally estimated at 3.7% of gross domestic product (GDP); this was 0.7 percentage points less than in the same 10-month period a year ago.
-
The current budget - borrowing to fund day-to-day public sector activities - was in surplus by £40.9 billion in January 2026; this brings the total current budget deficit in the financial year to January 2026 to £55.9 billion, which is £18.0 billion or 24.3% less than in the same 10-month period a year ago.
-
Public sector net debt excluding public sector banks - a measure of the amount of money owed to the UK private sector and overseas less any liquid assets held - was provisionally estimated at 92.9% of GDP at the end of January 2026 and remains at levels last seen in the early 1960s.
-
Public sector net financial liabilities excluding public sector banks - which considers a wider range of financial assets and liabilities than net debt - were provisionally estimated at 82.4% of GDP at the end of January 2026, 10.5 percentage points less than for public sector net debt.
-
Central government net cash requirement (excluding UK Asset Resolution Ltd and Network Rail) - the additional cash needed to be raised from the financial markets to finance activities - was in surplus by £39.8 billion in January 2026; this was a £24.6 billion or 161.4% larger surplus than in January 2025.
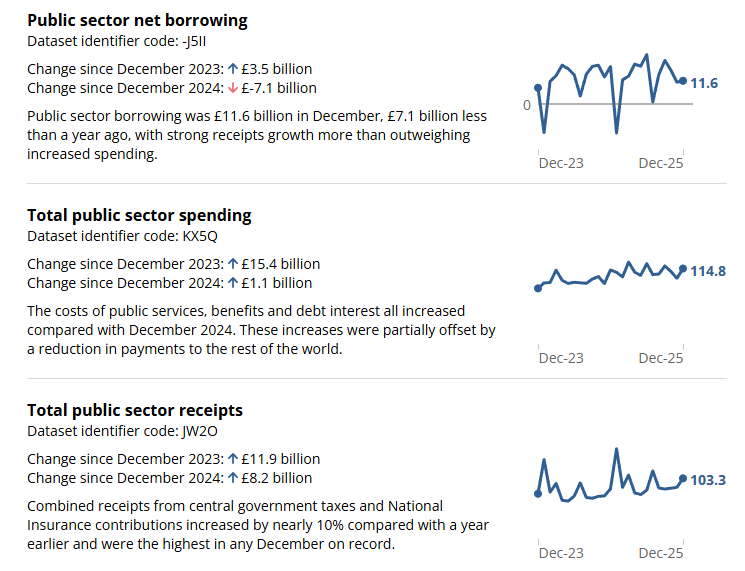
Borrowing - the difference between total public sector spending and income - was £11.6 billion in December 2025; this was £7.1 billion or 38.0% less than December 2024 and the 10th highest December since monthly records began in 1993 (not adjusted for inflation).
- Borrowing in the financial year to December 2025 was £140.4 billion; this was £0.3 billion or 0.2% less than in the same nine-month period of 2024, but still the third-highest April to December borrowing on record (not adjusted for inflation), after those of 2020 and 2024.
- Borrowing in the financial year to December 2025 was provisionally estimated at 4.6% of gross domestic product (GDP); this was 0.2 percentage points less than in the same nine-month period of 2024.
- The current budget deficit - borrowing to fund day-to-day public sector activities - was £5.8 billion in December 2025; this brings the total current budget deficit in the financial year to December 2025 to £94.9 billion, which is £1.6 billion or 1.6% less than in the same nine-month period of 2024.
- Public sector net debt excluding public sector banks - a measure of the amount of money owed to the UK private sector and overseas less any liquid assets held - was provisionally estimated at 95.5% of GDP at the end of December 2025; this was 0.9 percentage points more than at the end of December 2024 and remains at levels last seen in the early 1960s.
- Public sector net financial liabilities excluding public sector banks - which considers a wider range of financial assets and liabilities than net debt - were provisionally estimated at 85.0% of GDP at the end of December 2025; this was 2.5 percentage points more than at the end of December 2024, but 10.5 percentage points less than for public sector net debt.
- Central government net cash requirement (excluding UK Asset Resolution Ltd and Network Rail) - the additional cash needed to be raised from the financial markets to finance activities - was £14.5 billion in December 2025; this was £4.9 billion or 25.2% less than in December 2024.
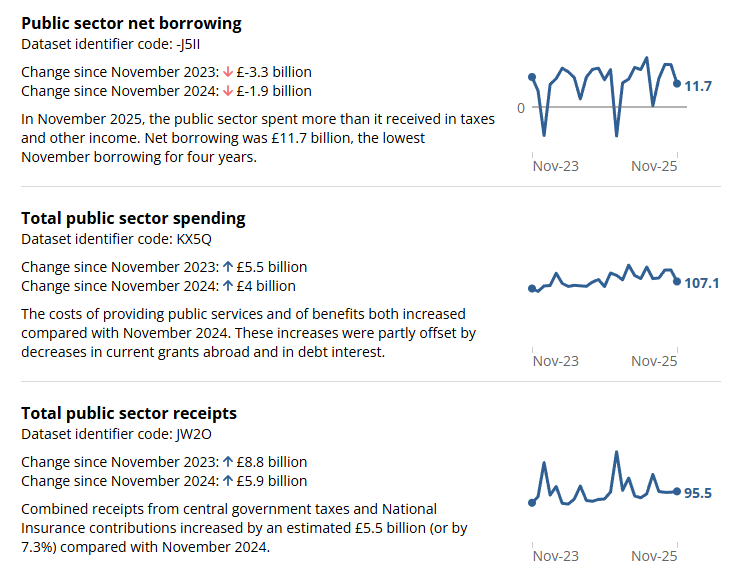
Borrowing - the difference between total public sector spending and income - was £11.7 billion in November 2025; this was £1.9 billion (or 14.0%) less than November 2024 and the lowest November borrowing since 2021 (not adjusted for inflation).
-
Borrowing in the financial year to November 2025 was £132.3 billion; this was £10.0 billion (or 8.2%) more than in the same eight-month period of 2024 and the second-highest April to November borrowing on record (not adjusted for inflation), after that of 2020.
-
Borrowing in the financial year to November 2025 was provisionally estimated at 4.4% of gross domestic product (GDP); this was 0.1 percentage points more than in the same eight-month period of 2024.
-
The current budget deficit - borrowing to fund day-to-day public sector activities - was £5.6 billion in November 2025; this brings the total current budget deficit in the financial year to November 2025 to £93.0 billion, which is £7.0 billion (or 8.1%) more than in the same eight-month period of 2024.
-
Public sector net debt excluding public sector banks - a measure of the amount of money owed to the UK private sector and overseas, less any liquid assets held - was provisionally estimated at 95.6% of GDP at the end of November 2025; this was 0.3 percentage points more than at the end of November 2024 and remains at levels last seen in the early 1960s.
-
Public sector net financial liabilities excluding public sector banks - a wider range of financial assets and liabilities than net debt - were provisionally estimated at 85.1% of GDP at the end of November 2025; this was 2.7 percentage points more than at the end of November 2024, but 10.5 percentage points less than for public sector net debt.
-
Central government net cash requirement (excluding UK Asset Resolution Ltd and Network Rail) - the additional cash needed to be raised from the financial markets to finance activities - was £13.6 billion in November 2025; this was £2.7 billion (or 16.8%) less than in November 2024.
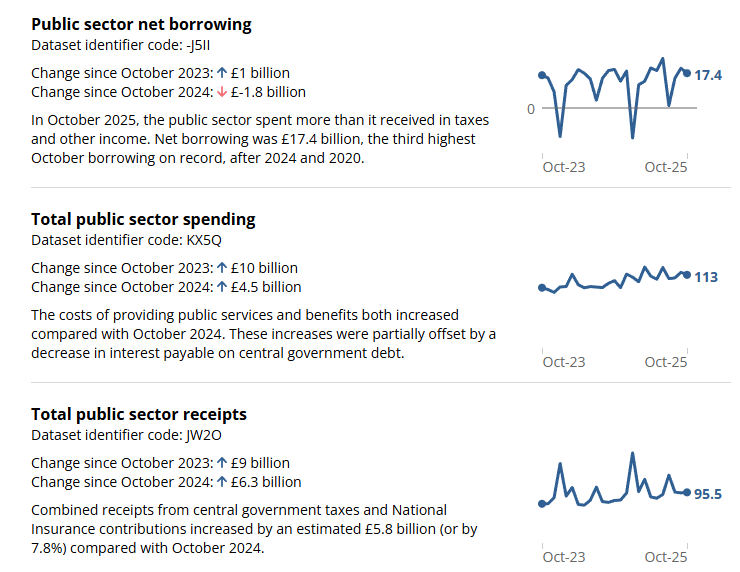
Borrowing – the difference between total public sector spending and income – was £17.4 billion in October 2025; this was £1.8 billion (or 9.6%) less than October 2024 but the third-highest October borrowing (not adjusted for inflation) since monthly records began in 1993, after those of 2024 and 2020.
-
Borrowing in the financial year to October 2025 was £116.8 billion; this was £9.0 billion (or 8.4%) more than in the same seven-month period of 2024 and the second-highest April to October borrowing (not adjusted for inflation) on record, after that of 2020.
-
Borrowing in the financial year to October 2025 was provisionally estimated at 3.9% of gross domestic product (GDP); this was 0.1 percentage points more than in the same seven-month period of 2024.
-
The current budget deficit – borrowing to fund day-to-day public sector activities – was £12.6 billion in October 2025; this brings the total current budget deficit in the financial year to October 2025 to £83.9 billion, which is £7.4 billion (or 9.7%) more than in the same seven-month period of 2024.
-
Public sector net debt excluding public sector banks was provisionally estimated at 94.5% of GDP at the end of October 2025; this was 0.2 percentage points less than at the end of October 2024 and remains at levels last seen in the early 1960s.
-
Public sector net financial liabilities excluding public sector banks were provisionally estimated at 84.0% of GDP at the end of October 2025; this was 2.5 percentage points more than at the end of October 2024, but 10.5 percentage points less than for public sector net debt.
-
Central government net cash requirement (excluding UK Asset Resolution Ltd and Network Rail) was £21.7 billion in October 2025; this was £1.9 billion (or 9.8%) more than in October 2024.
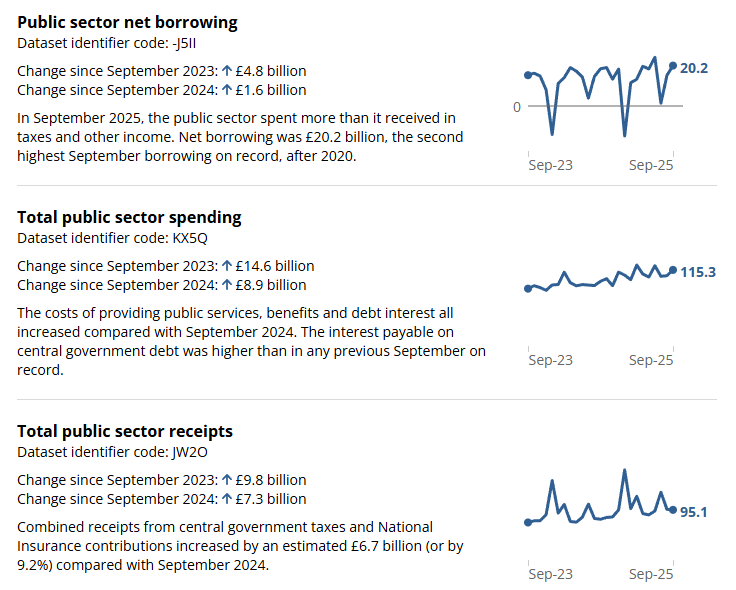
Borrowing – the difference between total public sector spending and income – was £20.2 billion in September 2025; this was £1.6 billion (or 8.6%) more than in September 2024 and the highest September borrowing since 2020.
- Borrowing in the financial year to September 2025 was £99.8 billion; this was £11.5 billion (or 13.1%) more than in the same six-month period of 2024 and the second-highest April to September borrowing since monthly records began in 1993, after that of 2020.
- The current budget deficit – borrowing to fund day-to-day public sector activities – was £13.4 billion in September 2025; this brings the total current budget deficit in the financial year to September 2025 to £71.8 billion, which is £10.6 billion (or 17.2%) more than in the same six-month period of 2024.
- Public sector net debt excluding public sector banks was provisionally estimated at 95.3% of gross domestic product (GDP) at the end of September 2025; this was 1.0 percentage points more than at the end of September 2024 and remains at levels last seen in the early 1960s.
- Public sector net financial liabilities excluding public sector banks were provisionally estimated at 83.8% of GDP at the end of September 2025; this was 3.0 percentage points more than at the end of September 2024, but 11.5 percentage points less than for public sector net debt.
- Central government net cash requirement (excluding UK Asset Revolution Ltd and Network Rail) was £15.9 billion in September 2025; this was £2.6 billion (or 19.8%) more than in September 2024.
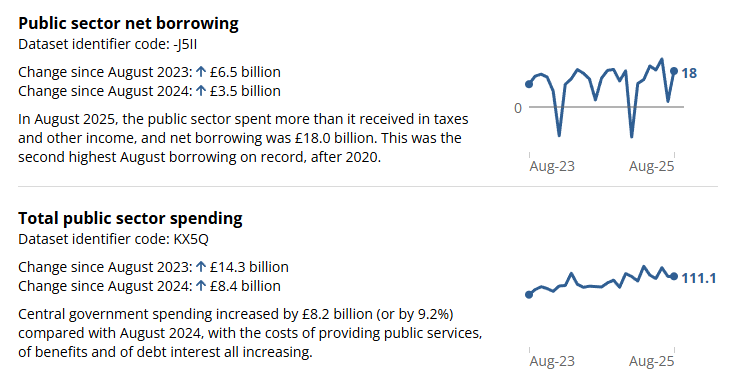
UK public sector net borrowing was £18.0 billion in August 2025, up +£3.5 billion YoY and the highest August in five years, reflecting stronger current spending and debt interest.
-
FY-to-date (Apr–Aug) borrowing reached £83.8 billion, +£16.2 billion YoY and £11.4 billion above the OBR’s March profile; August alone exceeded the £12.5 billion forecast by £5.5 billion.
-
The current budget deficit was £13.6 billion in August (+£3.7 billion YoY), with net investment at £4.3 billion (-£0.2 billion YoY).
-
Debt metrics edged higher: public sector net debt (ex-banks) was 96.4% of GDP (+0.5 ppts YoY); public sector net financial liabilities were 84.5% of GDP (+2.5 ppts YoY).
-
By subsector, central government borrowed £13.1 billion (+£3.9 billion YoY) and local government £4.2 billion (+£0.6 billion YoY); the Bank of England contribution fell to £1.0 billion (-£0.8 billion YoY).
-
Central government receipts were £84.3 billion (+£4.3 billion YoY): taxes +£1.6 billion (Income Tax +£1.0 billion; VAT +£0.2 billion; Corporation Tax +£0.1 billion) and compulsory social contributions +£2.6 billion after April NICs changes.
-
Self-assessed Income Tax total for Jul–Aug was £16.8 billion, +£2.5 billion YoY; August alone was £1.3 billion (-£0.2 billion YoY).
-
Central government current expenditure rose to £89.1 billion (+£7.8 billion YoY), driven by departmental spending +£3.7 billion, debt interest £8.4 billion (+£1.9 billion, including £2.6 billion RPI “capital uplift”), and social benefits +£1.1 billion.
-
Central government net investment in August was £4.7 billion (roughly unchanged YoY); FY-to-date net investment is £36.1 billion (-£13.1 billion YoY), partly reflecting lower transfers to the BoE APF.
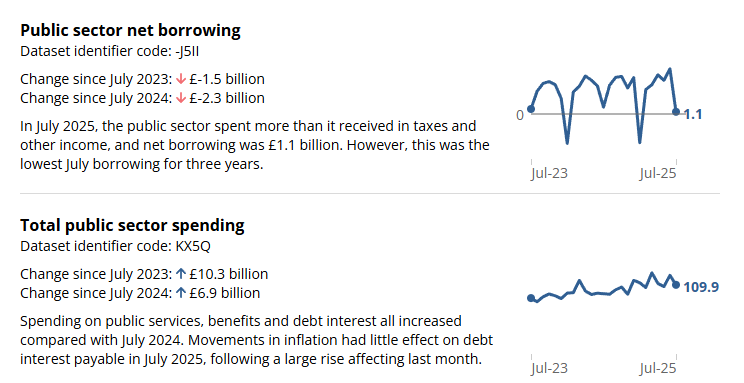
UK public sector net borrowing stood at £1.1 billion (vs £2.6 billion expected) in July 2025, down -£2.3 billion YoY, marking the lowest July figure in three years.
-
Self-assessed Income Tax receipts rose to £15.5 billion (+£2.7 billion YoY), though timing effects mean July–August combined figures provide a clearer comparison.
-
FY-to-date borrowing (Apr–Jul 2025) reached £60.0 billion (+£6.7 billion YoY), the third-highest on record for this period after 2020 and 2021.
-
The current budget was in a £3.3 billion surplus in July, but the FY-to-date deficit widened to £42.8 billion (+£5.4 billion YoY).
-
Public sector net debt was 96.1% of GDP at end-July (+0.5 ppts YoY), while net financial liabilities were 83.9% of GDP (+2.3 ppts YoY).
-
Central government receipts rose £8.8 billion YoY to £100.1 billion, led by Income Tax (+£4.5 billion), VAT (+£0.9 billion), and National Insurance contributions (+£2.6 billion).
-
Expenditure increased £5.3 billion YoY to £92.1 billion, driven by departmental spending (+£2.9 billion), higher social benefits (+£1.6 billion), and debt interest (+£0.2 billion).
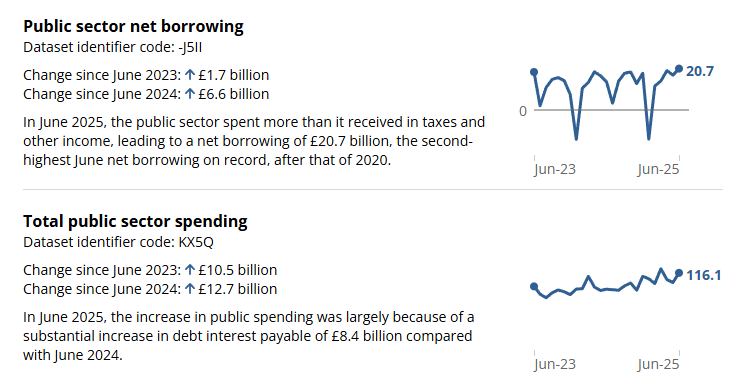
UK public sector net borrowing rose to £20.7 billion (vs £15.6 billion) in June 2025, up £6.6 billion YoY and £3.5 billion above the OBR’s forecast, marking the second-highest June figure since records began in 1993.
- Debt interest payments jumped to £16.4 billion (+£8.4 billion YoY), the second-highest June interest bill since 1997, driven by RPI-linked gilt payments.
- Central government receipts rose £5.7 billion YoY to £86.8 billion, led by increases in Income Tax (+£1.0 billion), VAT (+£0.7 billion), and Corporation Tax (+£0.5 billion).
- Compulsory social contributions rose £3.1 billion YoY to £17.4 billion after April National Insurance rate changes.
- Current expenditure rose £12.4 billion YoY to £97.1 billion, with higher departmental costs (+£2.0 billion) and social benefit payments (+£1.5 billion).
- FY-to-date borrowing (Apr–Jun 2025) totaled £57.8 billion (+£7.5 billion YoY), the third-highest on record; net debt stood at 96.3% of GDP (+0.5 ppts YoY).
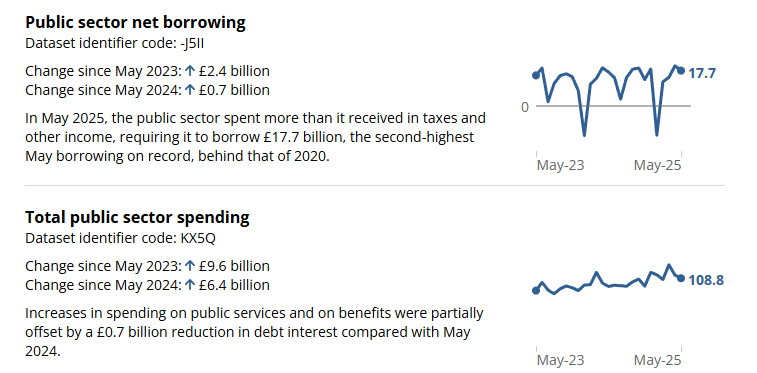
UK public sector net borrowing rose to £17.7 billion in May 2025 (vs £17.1 billion OBR forecast), up £0.7 billion YoY and the second-highest May figure since 1993.
- The current budget deficit fell by -£1.7 billion YoY to £12.8 billion, while net investment rose £2.3 billion to £4.9 billion.
- Central government receipts rose £5.3 billion YoY to £82.5 billion, led by a £3.5 billion increase in tax revenues and a £1.8 billion gain in social contributions.
- Expenditures increased £4.1 billion YoY to £89.2 billion, driven by departmental costs and inflation-linked benefit payments; debt interest fell by -£0.7 billion to £7.6 billion.
- Public sector net debt reached 96.4% of GDP, up 0.5 ppts YoY.
- FY to May 2025 borrowing totaled £37.7 billion (third-highest on record), with a £27.4 billion current deficit and £10.3 billion in net investment.