

AAR Rail Industry Overview: March 2026
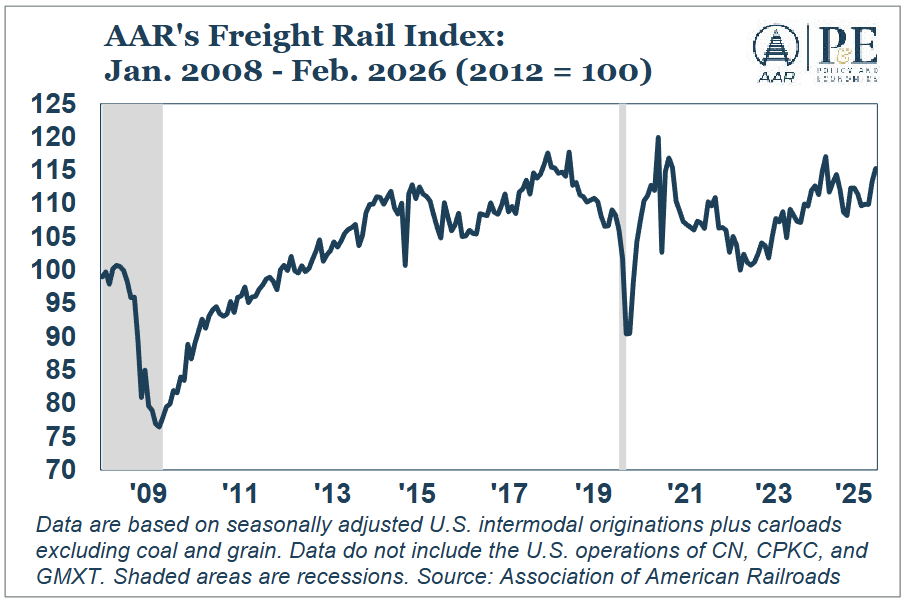
The AAR Freight Rail Index (FRI) tracks seasonally adjusted intermodal shipments and carloads excluding coal and grain, which together capture the rail traffic segments most sensitive to shifts in the broader economy. The index rose 1.8% in February over January, its third month-to-month increase in the past four months.
- Coal: In February 2026, coal carloads were up 6.9% over February 2025. Carloads averaged 58,659 per week in February, the most since September 2025. Carloads for the first two months of 2026 were up 5.8%, or nearly 26,000 carloads, over last year. So far in 2026, coal accounts for 26.6% of non-intermodal rail volume, well ahead of chemicals (15.3%) and grain (11.2%). Rail coal shipments have been supported by a combination of cold weather, firmer natural gas prices, and elevated electricity demand. Together, those factors have improved coal burn economics and helped lift rail coal volumes early in the year.
- Carloads Excluding Coal: U.S. carloads excluding coal rose 6.3% in February, their strongest year-over-year percentage gain in more than two years. Carloads excluding coal have seen year-over-year increases in 22 of the past 25 months, showing that freight demand outside coal has remained more resilient than many headline indicators might suggest. For the year to date through February, carloads were up 5.4% and, at 1.29 million, were the most since 2015.
- Grain: U.S. grain carloads averaged 25,018 per week in February 2026, the highest weekly average for February since 1990 and the highest for any month since January 2021. For the first two months of 2026, grain carloads were up 21.8% over last year and were the most since 1990 (when a typical grain car held much less grain than today). Most variation in grain carloads reflects changes in export demand, and grain exports have been strengthening. The USDA recently projected that U.S. corn exports will set a record this year. Because corn accounts for roughly half of U.S. grain carloads, that export strength is translating directly into stronger rail volume.
- Chemicals: U.S. rail carloads of chemicals entered 2026 with solid momentum, building on a record-setting performance in 2025. In February, chemical carloads rose 3.3% over last year. Average weekly chemical carloads in February were 34,606, the most ever for any month. In the first two months of 2026, chemical carloads totaled more than 269,000, up 2.9% over last year and a record for the first two months of a year. Looking ahead, geopolitical tensions in the Middle East bear watching because they could put upward pressure on natural gas prices. A sustained rise would weigh on the competitiveness of energy-intensive U.S. chemical production, which could eventually soften chemical carloads even as higher natural gas prices support coal demand.
- Motor Vehicles & Parts: North American rail carloads of motor vehicles rose 3.1% in February, their first year-over-year gain in six months, and weekly average carloads reached their highest level in five months. Still, the outlook remains mixed. The National Automobile Dealers Association recently forecast new vehicle sales at 16.0 million in 2026, down from 16.2 million in 2025. Affordability pressures remain significant, with higher sticker prices and elevated monthly payments continuing to sideline many buyers. At the same time, labor market uncertainty and policy-related volatility are complicating both production planning and consumer demand. Motor vehicles account for roughly 8% of U.S. rail revenue.
- A Decline in Railcars in Storage: The number of railcars in storage fell by nearly 18,000 in Febru¬ary, their first decline in six months, and every major railcar category saw fewer idled cars. If that trend continues, it would suggest freight demand is strengthening enough for railroads and other railcar owners to bring equipment back into service in a more meaningful way.
Attachments
1