


US Employment Situation: September 2025 (DELAYED)
Establishment Survey
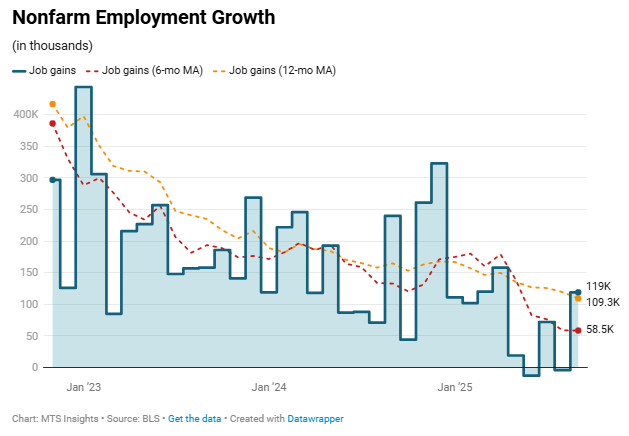
US nonfarm payroll employment increased by 119,000 in September, a surprise burst of strength exhibited by the labor market at the end of Q3. Not only was this increase above consensus expectations of a 50,000 increase, it was the largest increase since April and the third largest increase so far this year (just below March gain of 120,000). Most significantly, the strong growth in September reverses a string of weak readings that began in May and lasted through the summer, and resulted in job growth averaging around 18,500 over the course of those four months. Revisions in today’s report made those numbers look even worse as the July total was taken down -7,000 to 72,000, and the August total was revised down -26,000, such that employment fell -2,000 during the month.
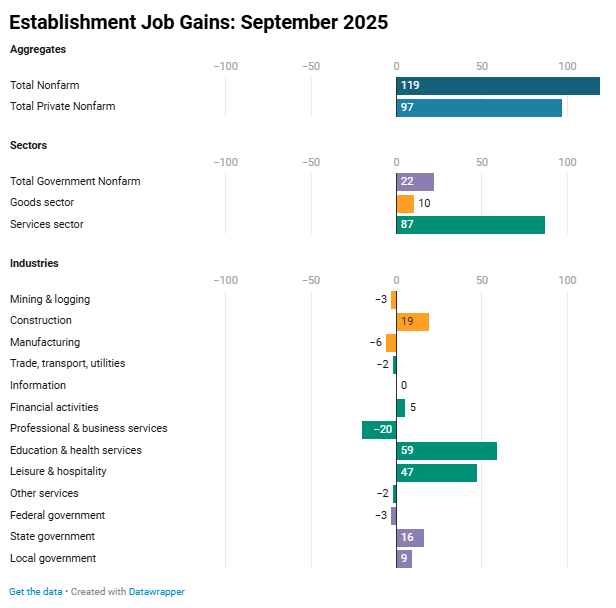
The headline number was supported by the strongest private payroll growth since April. The 97,000 jobs added by private sector firms were ahead of expectations of a 62,000 increase and substantially above the September ADP private sector employment change estimate of -29,000. As usual, the service sector provided most of the job growth, adding 87,000, while the goods sector only added 10,000. Two services industries specifically accounted for almost all of the increase in nonfarm payrolls: education and health services (+59,000) and leisure and hospitality (+47,000). Job growth in other industries was a wash. Notably, with the Trump admin’s focus on tariffs in mind, manufacturing employment fell for the 5th straight month since the reciprocal tariffs were put in place in April (down -58,000 cumulative since then).
Government job growth made a small positive contribution at +22,000. This included federal employment down -3,000, offset by 25,000 jobs added in state & local governments. This, of course, doesn’t include the job losses that may have come about as a result of the reduction in force orders during the government shutdown. Jobless claims data suggest that the number was not insignificant. Initial claims by federal employees totaled 5,719 in the week of November 8th, well above 615 in the same week a year ago.
Taken as given, the data from the Establishment survey looked pretty solid. Hiring appears to have bounced back after a weak summer, and the private sector accounted for a majority of the increase. The breadth of job gains across industries was not great, but there didn’t appear to be evidence of widespread layoffs. The one caveat is that these numbers are likely to be revised, and revisions have not been friendly.
Household Survey
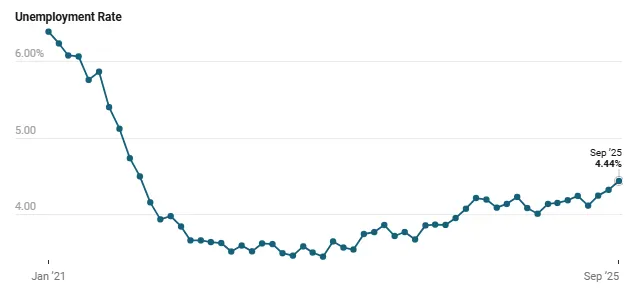
If you were optimistic reading through the Establishment survey data, this is the part of the report where things get ugly. The headline unemployment rate saw a significant increase in September, rising 13 bps to 4.44%, above expectations of it remaining at 4.3% and the highest since October 2021. This increase wasn’t a matter of rounding. The print came within 1.1 bps of rounding up to 4.5%. It sounds nitpicky to comment at this level of detail, but it is important to note these things since a majority of people view these data points as a single data point. The takeaway is that there was a solid, measurable increase in unemployment in September, confirming a clear trend that has been established this year.
The increase in the unemployment rate came from an increase in the total number of unemployed (+219,000) that resulted from a sizeable increase in the civilian labor force (+470,000). While there was an increase in the employed population (+251,000) and the employment rate (+0.1 ppts to 59.7%), the raw increase in the unemployed was just too high relative to the increase in the number of employed. Interestingly, this does contradict some Fed officials’ views on the labor market that suggest labor supply and labor demand are both going down, leading to equilibrium rather than slack.
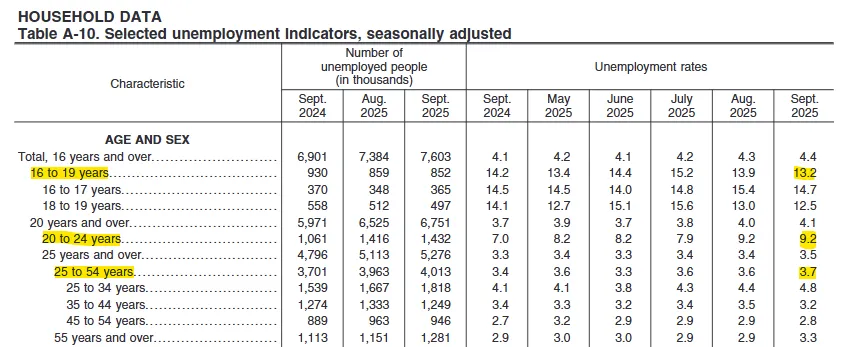
The age breakdown shows that prime-age and older workers drove the entire increase in September’s unemployment rate. The youngest cohort, 16 to 19 years, actually saw a notable decline in their jobless rate to 13.2%, and workers aged 20 to 24 held steady at 9.2%. With younger groups either improving or unchanged, the pressure came from older segments. The prime age unemployment rate rose 0.1 ppts to 3.5%, the 55 and over rate jumped 0.4 ppts to 3.3%, and early prime age workers posted the sharpest move with a 0.4 ppt increase to 4.8%. This pattern points to a weaker labor market because job losses are increasingly concentrated among core working-age adults rather than temporary or seasonal young workers, signaling more persistent underlying softness rather than noise in the data.
The Household survey data make it clear that unemployment moved meaningfully higher in September. On top of that, the increase in the labor force and in the participation rate push back against the notion that the labor market is in a sort of equilibrium state where labor supply and labor demand are both falling in tandem, such that there was nothing more than a slow cooling in the labor market.