


US GDP: Q2 2025 (3rd Estimate)
GDP
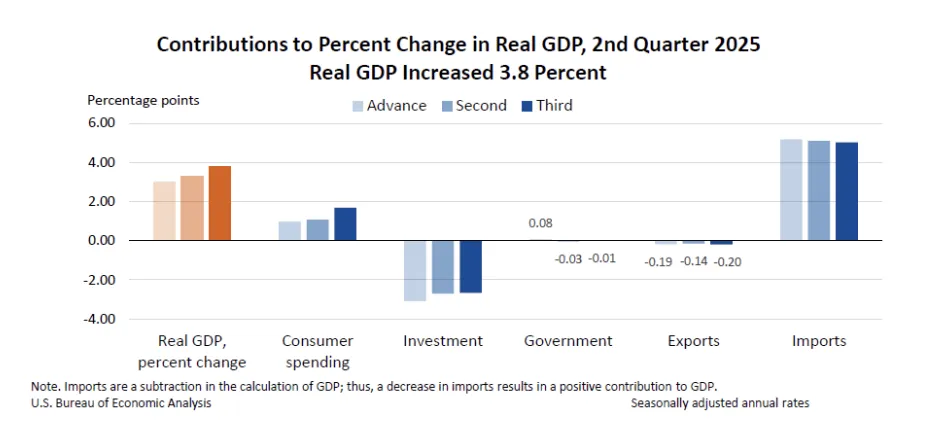
The final estimate of Q2 2025 GDP growth saw a strong upward revision this morning to a SAAR of 3.8%. This is up significantly from the second estimate of 3.3% and the advance estimate of 3.0%, and the revision confirms that Q2 2025 GDP growth was the strongest in a quarter since Q3 2023. The positive adjustment was most heavily driven by the consumer spending segment of growth, but most of the other components also saw upward revisions.
- Personal consumption increased at a SAAR of 2.5% in Q2 2025, according to the final estimate, revised up significantly from the 2nd estimate of 1.6%. That revision was entirely driven by spending on services, which actually increased 2.6% in Q2, much higher than the 2nd estimate of 1.2%. Offsetting the strong upward revision in services spending was a slight downward revision to goods spending from 2.4% in the 2nd estimate to 2.2%. Overall, the consumer spending component contributed 1.68 ppts to headline GDP growth (vs 1.07 ppts in the 2nd estimate), accounting for the entire 0.5 ppts upward revision.
- The estimated growth in gross private domestic investment in Q2 was unchanged at -13.8% in the final estimate. This reflects a slight upward revision in fixed investment growth, offsetting a downward revision in the private inventories component. Within fixed investment, nonresidential investment grew 7.3% (vs 5.7% in 2nd estimate), and residential investment declined -5.1% (vs -4.7% in 2nd estimate).
- The net exports component’s positive contributions were revised down slightly from 4.95 ppts in the 2nd estimate to 4.83 ppts in the final estimate. Exports saw a slightly larger decline of -1.8% (vs -1.3% in 2nd estimate), and the decline in imports was adjusted up slightly to -29.3% (vs -29.8% in 2nd estimate).
- Much like the investment component, the growth in government consumption and investment in Q2 did not see much of a revision at -0.1%, up slightly from -0.2% in the 2nd estimate. Within the segment, the divergence between federal and state & local consumption and investment intensified with the former at -5.3% (vs -4.7% in the 2nd estimate) and the latter at 3.1% (vs 2.6% in the 2nd estimate).
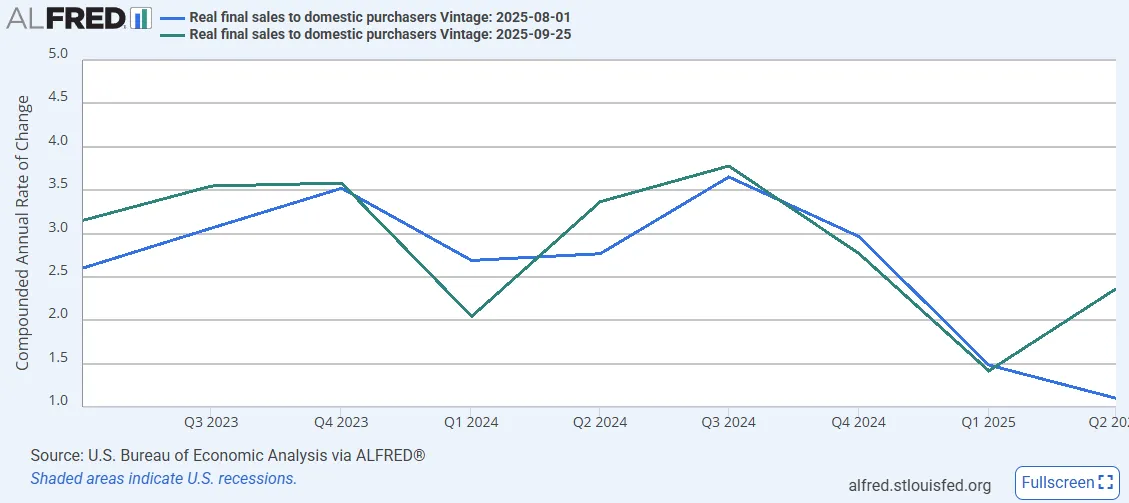
The final GDP revisions challenge the narrative of a slowing U.S. economy. Final sales to domestic purchasers, a measure that strips out the volatile swings in net exports and inventories, came in at 2.4%, more than double the initial estimate of 1.1% and well above the second estimate of 1.6%. These points more clearly to a rebound from Q1’s weakness, underpinned by stronger consumer spending, and stand in contrast to softer labor market data from Q2. Notably, the solid Q2 performance came even as federal government spending made a second consecutive negative contribution of more than -0.3 ppts to growth.
PCE Inflation
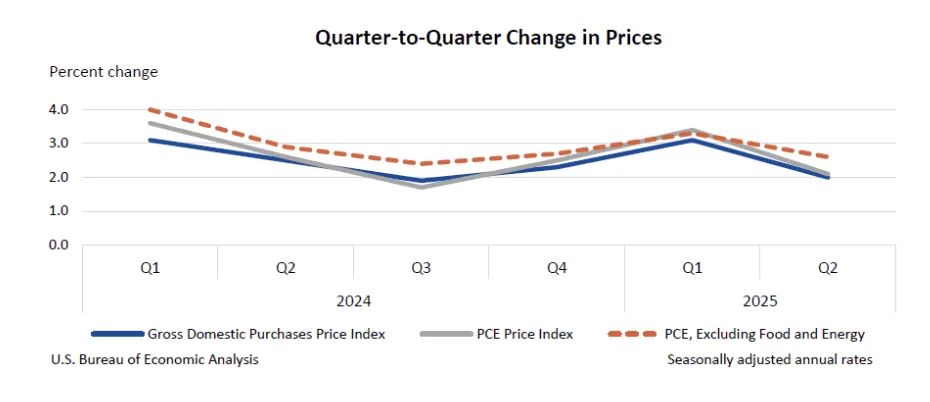
The other significant revision to acknowledge in the final Q2 2025 GDP report was upward revisions to both headline and core PCE inflation. Both were adjusted up by 0.1 ppt to 2.1% and 2.6%, respectively, and added to stronger price growth, which saw the gross domestic purchases price index by revised up to 2.0% (from 1.8% in the 2nd estimate). However, this didn’t have an impact on longer-term inflation because Q1 2025 price data was revised down. As a result, the YoY rates for PCE and core PCE inflation were unchanged at 2.4% YoY and 2.7% YoY, respectively. Similarly, the gross domestic purchasers annual rate was unchanged at 2.3% YoY. The changes in the price data likely just reflect the newly discovered strength in consumer spending in Q2, and another slight downward revision to Q2 data.
Industry GDP
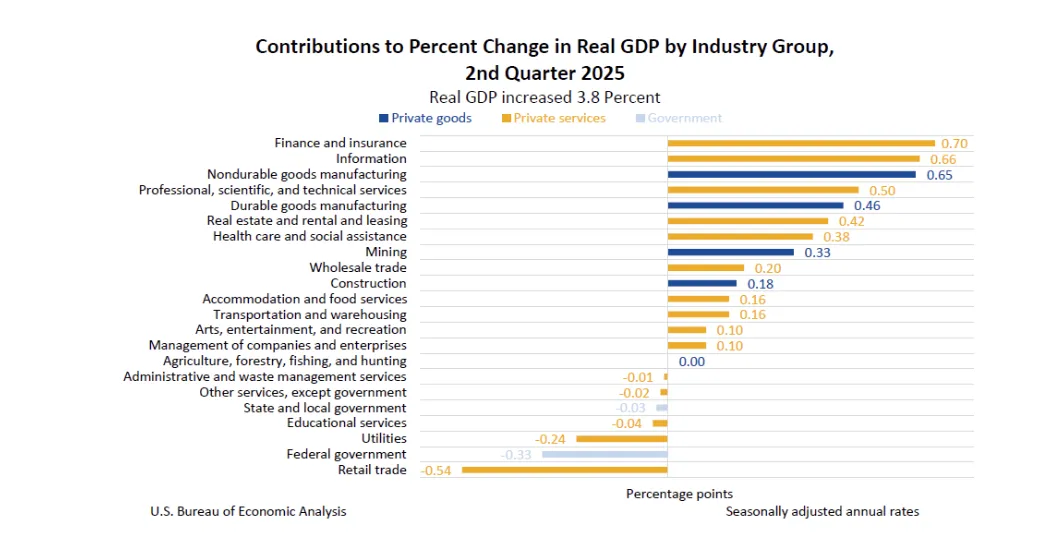
The final GDP report also provides us with a view of how GDP trended by industry. In Q2, the goods sector was the primary driver of growth, with real value added up at a SAAR of 10.2%. This was supplanted by a solid quarter for the services sector, up 3.5%, and dampened by a weak government sector, down -3.2%. The strongest industries in Q2 were finance & insurance (+0.70 ppts) and information (+0.66 ppts), suggesting that AI factors and a strong equity market were key drivers of growth in the quarter. While these segments were strong, the full manufacturing industry (combining durable and nondurables) added 1.11 ppts of growth and stands out as the top performer. This was likely fueled by tariffs which have caused domestic producers to see an increase in demand from local customers who want to avoid import duties and foreign customers trying to front-run the higher tariff rates.