


US CPI: May 2025
The key US inflation indexes saw softer-than-expected increases in May across the board, as the effects of tariffs on consumer prices appear to be tame so far. Both headline and core inflation came in below consensus estimates, reinforcing the view that inflationary momentum is cooling. Core goods prices remain weak, shelter inflation continues to moderate, and energy prices are still in deflation on a YoY basis. Short-term inflation dynamics are softening in a way that suggests the Fed should adopt a more dovish stance, especially as growth concerns rise and markets begin pricing in renewed policy easing.
Headline CPI
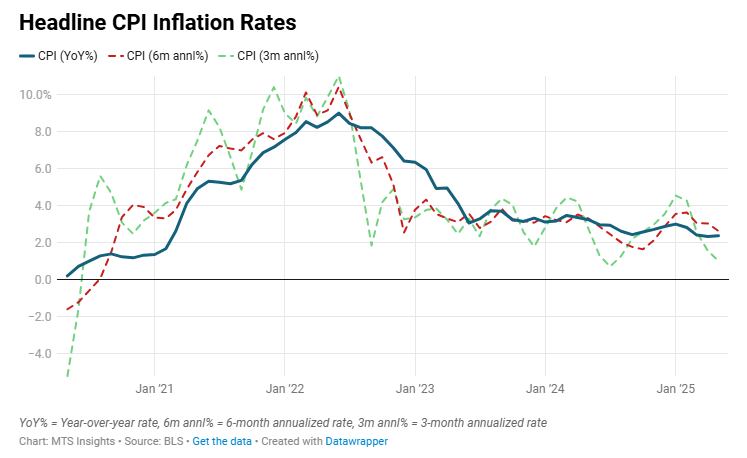
The headline CPI index increased 0.1% MoM and 2.4% YoY in May, slightly ahead of the 2.3% YoY gain in April. However, the May moves were both below the consensus projections of 0.2% MoM and 2.5% YoY. Energy continues to be a major source of deflation for the all items index, and the major goods and services categories elsewhere saw inflation that only somewhat offset it. Here is how the two volatile segments trended in May:
- The Food index increased 0.3% MoM in May, reversing the -0.1% MoM drop seen in April. Price gains were even across the food at home and the food away from home categories which both increased 0.3% MoM. Egg prices continue to fall, down another -2.7% MoM, and were offset by a 1.1% MoM increase in cereals & bakery product prices, which is the largest monthly increase in that subindex since November 2022. Food inflation continued a steady upward trend, up 2.9% YoY in May, which is noticeably higher than the 2.0-2.2% YoY range that was seen during 2024.
- The Energy index reversed the 0.7% MoM gain in April, falling -1.0% MoM in May. Gas price increases to start the summer were unusually weak, and the index fell -2.6% MoM after seasonal adjustment (-0.7% MoM before seasonal adjustment). The natural gas index fell -1.0% MoM, and the electricity index increased 0.9% MoM. There is an interesting divergence within energy in the annual rates; energy goods prices are down -11.6% YoY while energy services prices are actually up 6.8% YoY (the largest YoY gain since March 2023). However, the deflation in goods (especially gasoline) is stronger and keeps the Energy index in deflation at -3.3% YoY.
Core CPI
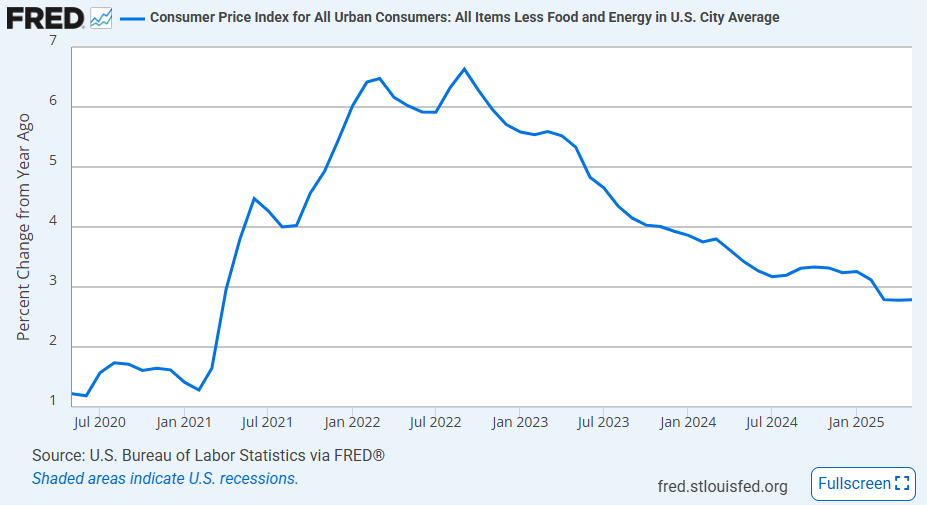
To go along with the soft headline CPI print, the core CPI index (excluding food and energy) saw a small gain of 0.1% MoM in May. At one decimal, this monthly rate looks like the 0.1% MoM increase in March, but at two decimals, the May rate looks a bit hotter. Specifically, core CPI increased 0.13% MoM in May, about 7 bps higher than the 0.06% MoM increase in March. Regardless, the low MoM rate and the unchanged annual rate of 2.8% YoY were below expectations of increases of 0.3% MoM and 2.9% YoY. In that context, the core inflation print looks especially soft. Here is how the key segments looked:
- Core goods prices were unchanged in May, preserving a trend of soft goods inflation prints even though some may have expected there to be a reaction to three months of tariffs. Declines in used cars and trucks (-0.5% MoM) and new vehicles (-0.3% MoM) were the main drag on goods inflation along with a -0.4% MoM drop in apparel prices. Other indexes posted more moderate gains like medical care goods (+0.6% MoM), household goods (+0.3% MoM), and recreational goods (+0.4% MoM).
- Core services inflation remained subdued at just 0.2% MoM in May. The increase was the 3rd weakest since the inflationary 2021-2022 period began, only faster than the March 2025 and June 2024 prints. Most indexes saw negligible to no change in prices: medical care services (+0.2% MoM), transportation services (-0.2% MoM), recreation services (-0.1% MoM), education & communication services (+0.1% MoM). The main reason for any gain in core services was shelter. Despite the soft print, the annual rate remained unchanged at 3.6% YoY.
- The Shelter index was up 0.3% MoM with owners’ equivalent rent up 0.3% MoM, the softest print since February. On an annual basis, the Shelter index was up 3.9% YoY which is the smallest since November 2021. The large weight of this index means that it still contributes 1.4 ppts to the headline CPI YoY rate.
- The motor vehicle insurance index has been in focus over the last year due to its rapid rise, and in May, it saw another sizeable gain of 0.7% MoM. The annual rate has come down due to base effects, but it remains elevated at 7.0% YoY, contributing about 20 bps to the headline annual inflation rate.
In totality, the May CPI report is further evidence that inflationary pressures in the US economy are continuing to fizzle out due to economic weakness that has developed in the first few months of the year. Specifically, weaker consumer confidence and uncertainty in business outlooks appear to be translating into a more tangible weakness visible in prices. Importantly, pricing pressures from tariffs have largely not filtered into consumer prices so far. Short-term core goods inflation (measured by the 3-month annualized rate) actually turned negative in May at -0.3% MoM after being as high as 1.9% in Q1 2025. The trend in core services is similar, as the short-term measure for that segment is down to 2.3% in May, the lowest since March 2021.
Market Reaction
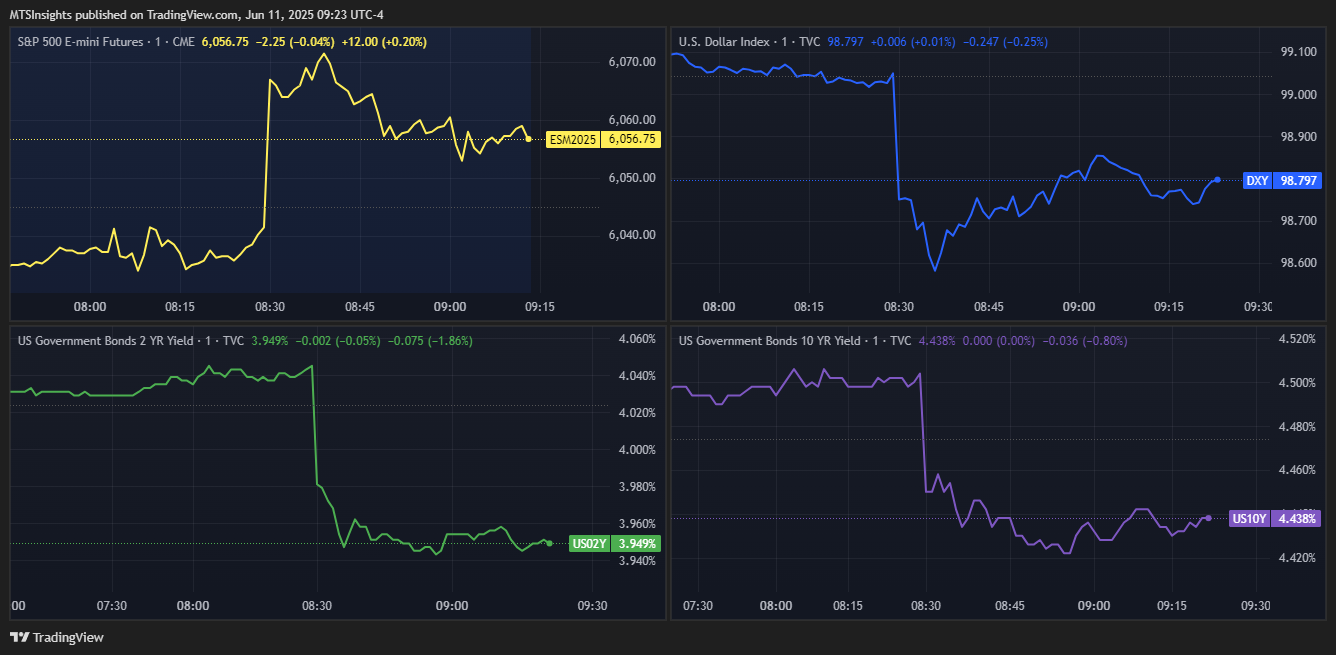
The market’s reaction to soft inflation in May was very dovish as investors became abruptly more bullish on equities and bonds. S&P futures jumped about 0.4% as soon as the report was released, shifting what was going to be a slight decline at open to a slight gain or flat. The reaction in yields was even more significant and a welcome sight to bond traders who have been struggling to cope with US debt fears. The 2-year yield dropped by as much as -10 bps right after the report was released, and it now sits below 4% after jumping past that level last week. The 10-year yield also dropped by about -6 bps, after it had been trending around 4.5% this morning. The soft inflation report could help the bond market shake the fiscal policy fears that have kept long-end interest rates high since Trump’s inauguration.
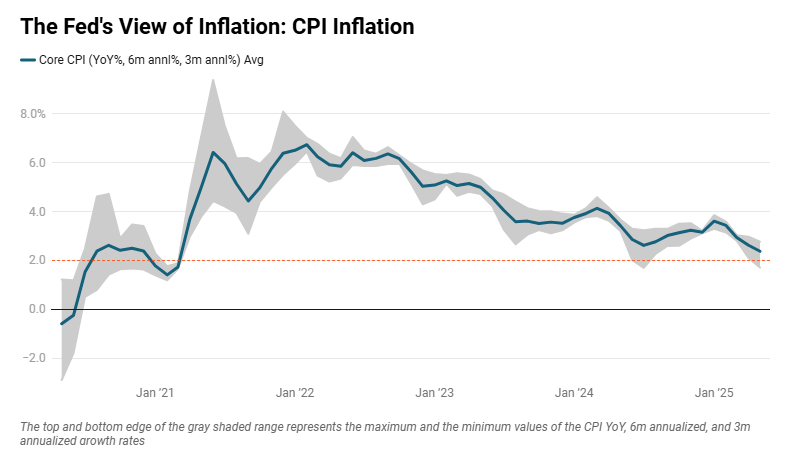
Instead, investors can shift back their focus to the Fed, which has been on the sidelines so far this year as it attempts to gauge how Trump’s policies will impact the inflation outlook. FOMC members have not been shy in showing that they believe high tariff rates will be at least a transitory upside risk to inflation, but as more and more evidence comes against that view, they might have to change their views. Soft prints like today’s CPI report should allow the Fed to push the inflation mandate closer to the back burner so that it can get back to managing the potential downside risks to the economy and the employment mandate.
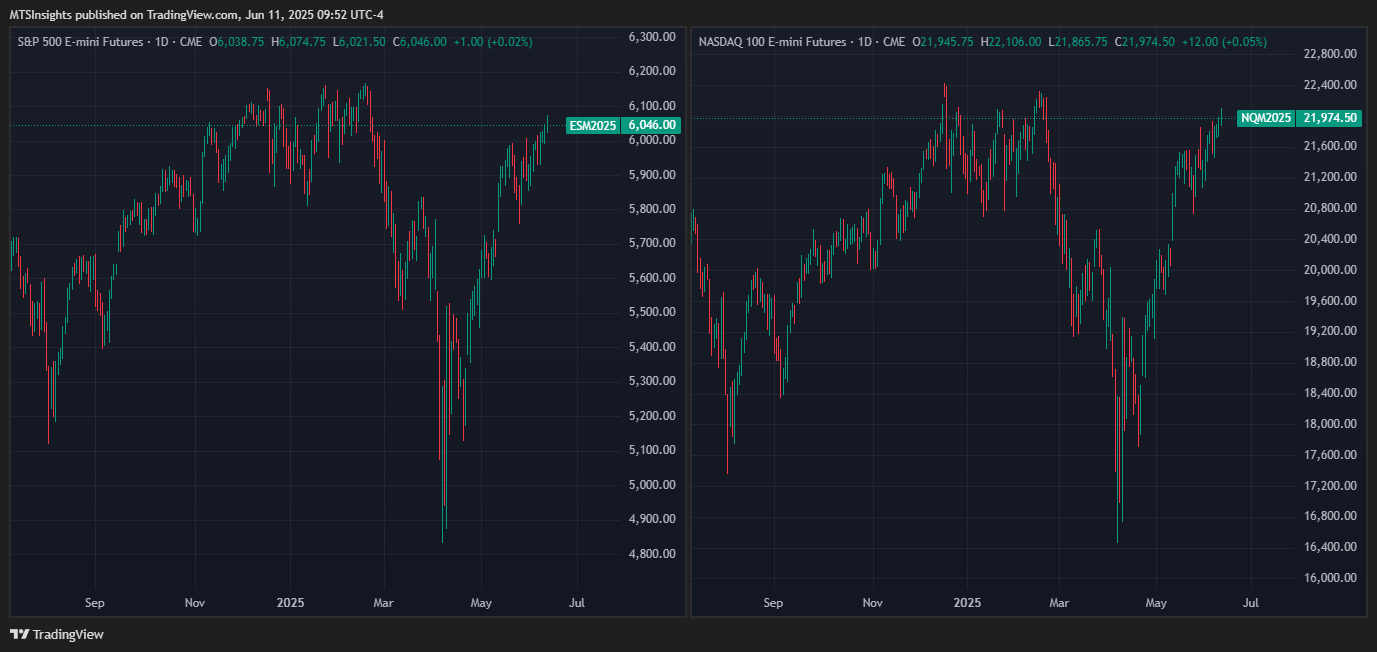
I believe that the Fed has been a bit too hawkish over the last few months, and that it should be close to cutting rates by 25 bps in this month’s meeting. The inflation data, especially the data from the last three months, suggests that the gradual weakening of consumption is becoming a slightly firmer decline. With that being said, if the Fed does move away from its hawkish viewpoint in the June meeting and SEP update, US equities can continue to rally from the tumultuous Q1 2025 and retest the all-time highs of early February.