


US CPI: April 2025
The April CPI report delivered another soft reading on inflation, reinforcing the growing evidence that price pressures in the US economy have meaningfully eased. Over the last three months, short-term measures of inflation have decelerated to levels consistent with the Fed’s 2% target. While markets remain cautious about the timing of rate cuts, the data increasingly supports the view that the Fed is closer to easing than many currently assume.
Headline Inflation
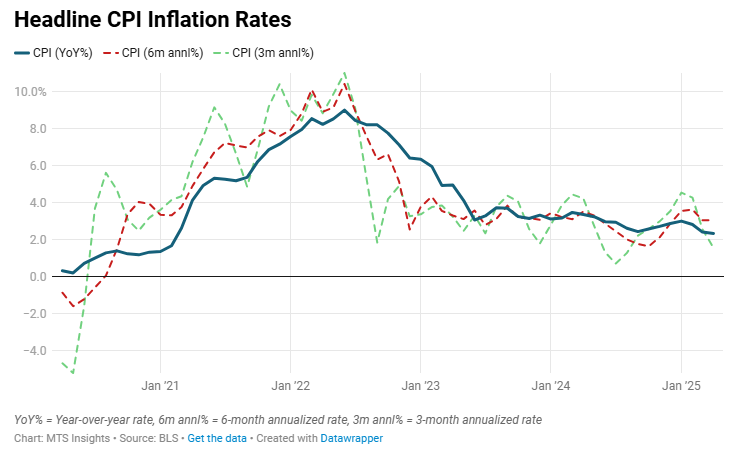
US CPI increased 0.2% MoM and 2.3% YoY in April. Both growth rates were below expectations of 0.3% MoM and 2.4% YoY increases. The annual increase is now the lowest since February 2021 as it dips below the 2.4% YoY increase seen in September 2024. While recent disinflation has a lot to do with the movement in energy prices, the CPI results over the last two months are very strong evidence that inflationary pressures are fading from the US economy. Here’s how the volatile components moved this month:
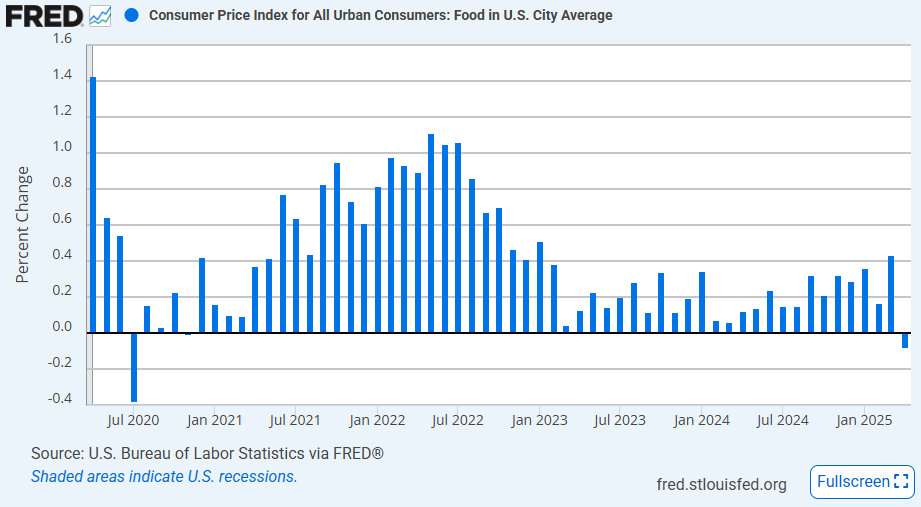
- Food prices saw their first monthly decline since November 2020, dropping -0.1% MoM in April. The decline was driven by a lower food at home segment, which saw the largest drop since September 2020 at -0.4% MoM. Five of the six grocery indexes fell on the month including a -1.6% MoM drop in meats, poultry, fish, and eggs that was heavily affected by consumer egg prices down -12.7% MoM. Offsetting some of the decline in grocery prices was a 0.4% MoM increase in food away from home which included a 0.6% MoM increase in full service meals.
- Energy prices saw a slight recovery in April, rising 0.7% MoM after the -2.4% MoM drop in March. The results in this segment were split between energy goods and energy services. Energy goods prices fell -0.2% MoM with the gasoline index down -0.1% MoM. The energy services segment increased 1.5% MoM as the electricity index increased 0.8% MoM and gas utility costs were up 3.7% MoM. Overall, consumers’ energy costs are remaining low due to weaker commodity prices.
Core Inflation
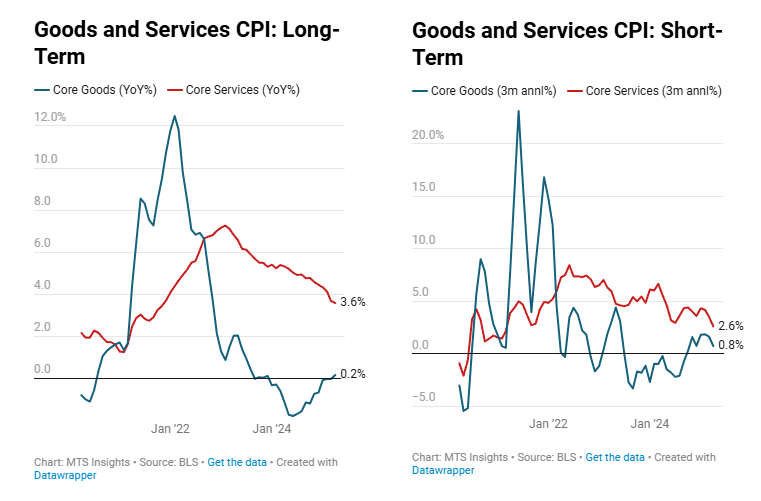
US core CPI inflation increased at a moderate pace of 0.2% MoM in April, keeping the annual rate unchanged at 2.8% YoY. While the monthly rate was slightly below expectations of a 0.3% MoM increase, the annual rate was in line with expectations. The core segments featured another month of cool goods price movement, while services prices saw moderate growth.
- The core goods CPI segment increased just 0.1% MoM in April after a slight decline in March. Declines were seen in the apparel (-0.2% MoM) and transportation commodities (-0.2% MoM) segments, led by used vehicle prices falling -0.4% MoM and new vehicle prices remaining unchanged. Outside of these segments, other core indexes posted moderate gains: household furnishings (+0.2% MoM), medical care goods (+0.4% MoM), and recreation goods (+0.4% MoM). On an annual basis, core good inflation is just 0.1% YoY, the lowest since December 2023.
- Within household furnishings, two indexes stick out. The appliance index was up 0.8% MoM in April, the largest increase since March 2022, and the furniture & bedding index jumped 1.5% MoM. The larger gains in these indexes could have been driven by tariff-related pressures since China and Canada are typical suppliers of these goods and their parts in the US.
- The core services CPI segment increased 0.3% MoM in April, returning to a more moderate increase after the 0.1% MoM increase in March. The movements of the services segments were mixed. Medical care services saw the largest monthly gain of 0.5%, but that was offset by cooler readings elsewhere: transportation services (+0.1% MoM), recreation services (-0.3% MoM), and education & communication services (-0.2% MoM). Core services CPI is now up just 3.6% YoY, the lowest since November 2021.
- Since most services segments were mixed, the broad move in core services was dominated by the heavily-weighted shelter index which increased 0.3% MoM in April. Both the rent of shelter index and the owners’ equivalent rent index increased 0.4% MoM, in line with the moderate increases we had seen throughout 2024. On an annual basis, owners’ equivalent rent inflation is the weakest in over three years at 4.3% YoY.
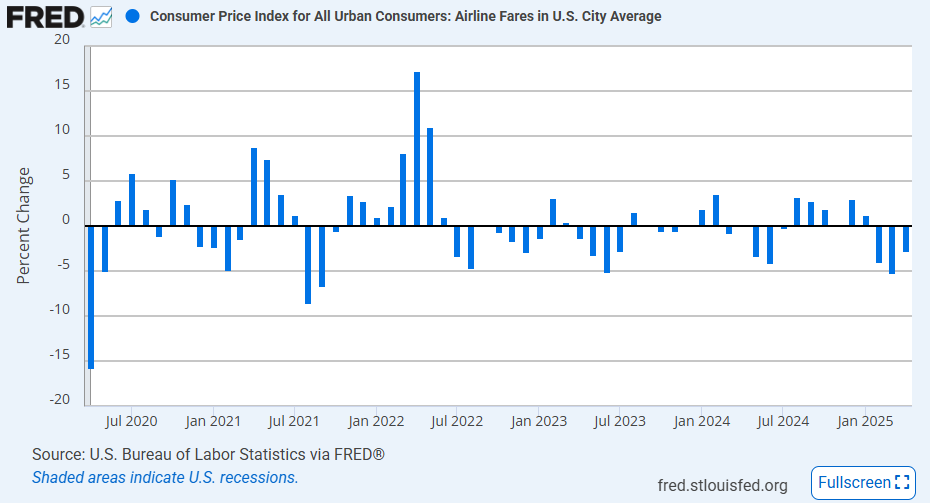
- Another notable result was the airline index seeing another sizeable decline in April. On a monthly basis, the index fell -2.8% MoM after a steep -5.3% MoM drop in March. The trend reflects how unstable tariff policy has started to impact tourism in the US, especially in international travel. Over the last year, airline fares are down -7.9% YoY, the weakest since December 2023.
- Additionally, a measure of core inflation that excludes the abnormalities in housing and vehicle prices continues to trend low. The special aggregate that removes energy, food, shelter, and used vehicles increased 0.2% MoM and is up just 1.8% YoY in April, where it also was in March.
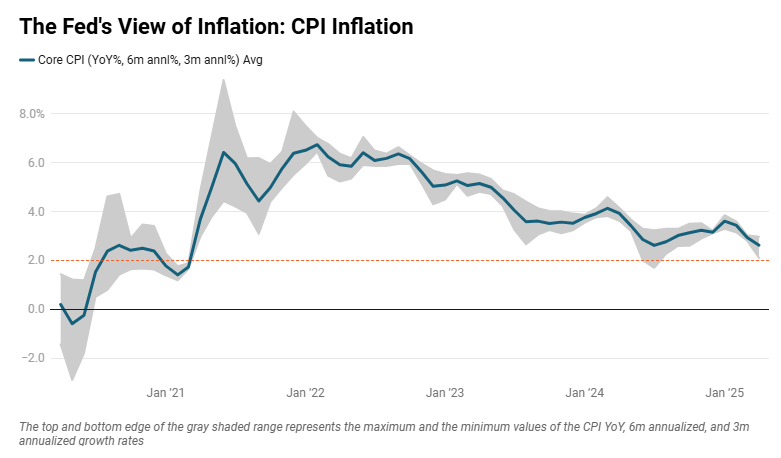
Another month of weak CPI readings means that measures of short-term inflation pressures have receded quickly. The annualized rate of quarterly CPI inflation has fallen to just 1.6% in April, the lowest since August 2024 and before that, the lowest since the pandemic. Similarly, the annualized quarterly rate for core CPI inflation has fallen to 2.1%, just slightly above the 2% target. If we were to adjust this short-term CPI rate to map onto a PCE rate, it would be around 1.8-1.9%, below the Fed’s target. In the chart above, I average three different core CPI rates that include information on inflationary pressures across different time horizons. That measure has fallen to its lowest since July 2024, around the time the Fed considered and eventually moved forward with the 50 bps rate cut.