


US CPI: March 2025
In the middle of an uncertain macro environment dominated by headlines about tariffs, the March CPI report provided a more optimistic view on the inflation situation. Soft monthly increases in headline and core inflation driven by declines in several key segments, including energy, may provide the Fed with enough room to cut rates in May if they so choose.
Headline Inflation
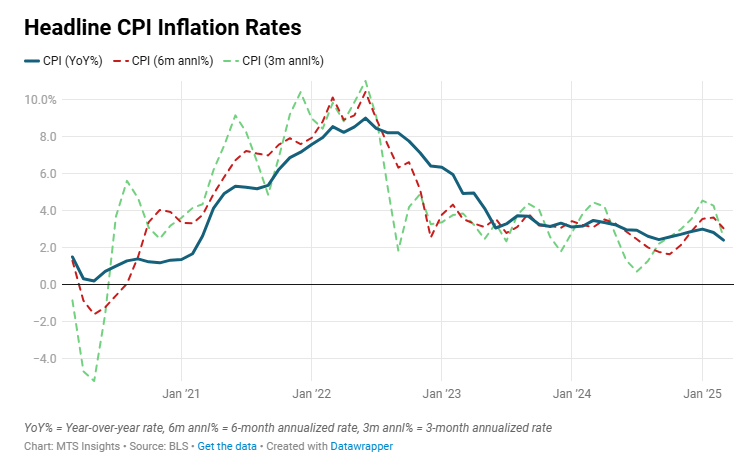
For the first time since the pandemic, US CPI saw a monthly decline, coming in at -0.1% MoM in March. With the negative monthly print, the annual rate slowed to 2.4% YoY, the lowest since September 2024, and well below expectations of a slowdown to 2.6% YoY (from 2.8% YoY in February). The negative headline monthly rate was largely a result of energy prices which saw a strong decline in March.
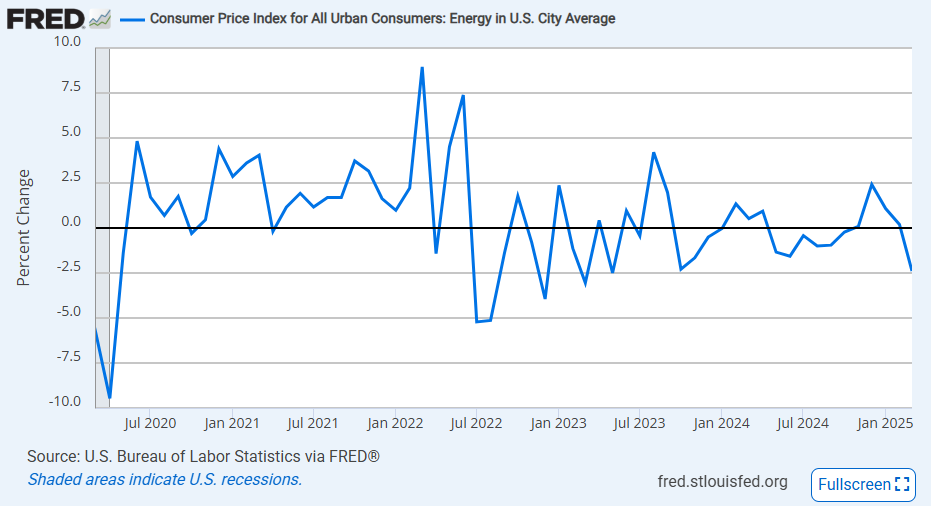
- The energy CPI component fell -2.4% MoM and -3.3% YoY, down from the -0.2% YoY increase in February. The monthly decline in energy was the largest since May 2023. The drop in gas prices in March drove the decline as that index fell -6.3% MoM (largest decline since December 2022). Its large weight offset rises in the natural gas index (+3.6% MoM) and electricity (+0.9% MoM).
- Food prices continued their uptrend, posting a moderately strong increase of 0.4% MoM and pushing the annual rate up to 3.0% YoY which is the largest annual increase since October 2023. Food at home prices were up 0.5% MoM with meats up 1.1% MoM and dairy up 1.0% MoM. Food away from home increased 0.4% MoM with prices for full service meals up 0.6% MoM. The trend in food prices which is typically categorized as volatile remains in a steady uptrend. Tariffs are only going to accelerate the trend.
Core Inflation
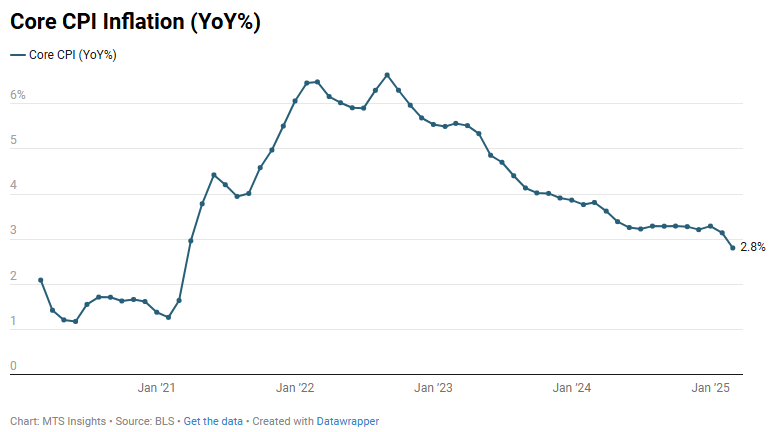
While the decline in energy prices played a major role in the decline in the headline index, the core inflation segment did come in softer than expected at 0.1% MoM, a monthly rate not seen since May and June of 2024. That soft print helped push core CPI inflation below the three percent threshold to 2.8% YoY in March, the lowest in four years. The disinflation was a result of cool trends in both goods and services that pointed to a broad decline in prices.
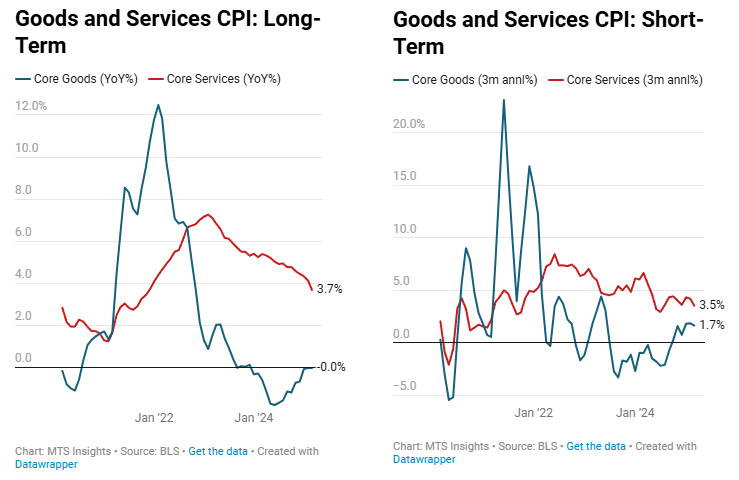
- The core goods segment declined -0.1% MoM in March, the first decline since August 2024. A major subsegment driving the decline was a -0.2% MoM move in transportation commodities that featured a -0.7% MoM decline in used vehicle prices. This offset a slight 0.1% MoM rise in new vehicle prices. There were declines in two other goods segments, medical goods (-1.1% MoM) and recreation goods (-0.3% MoM), and a flat MoM reading in household furnishings & supplies.
- The core services segment was only up 0.1% MoM, the first increase of that size since August 2021. Another sizeable decline in transportation services played a major role in the soft core print. It fell -1.4% MoM in March, the largest MoM decline since May 2020, after an -0.8% MoM decline in February. Within that index, motor vehicle insurance prices fell -0.8% MoM (largest decline since October 2021) and airfares fell -5.3% MoM (largest decline since September 2021).
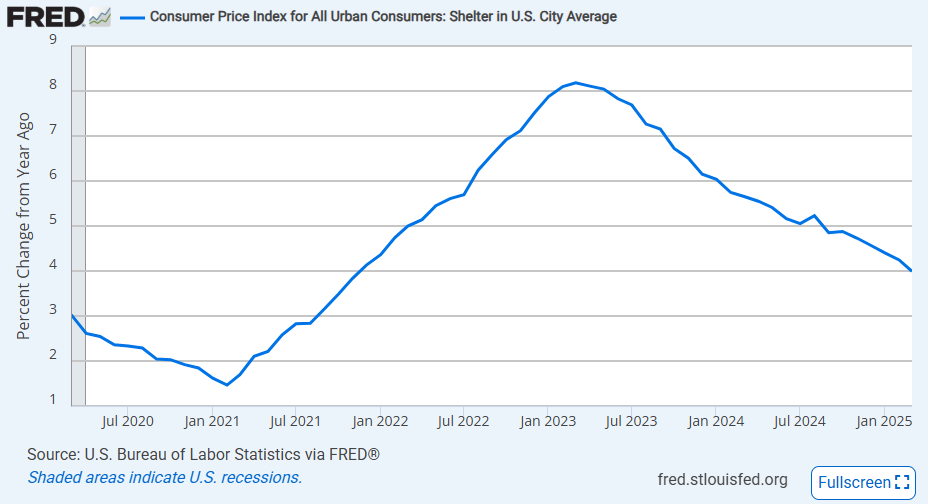
- The shelter CPI component increased just 0.2% MoM, the slowest since June 2024, and the annual increase cooled to 4.0% YoY, the lowest since November 2021. The cool reading is a bit deceptive. The subindex was affected by a -3.5% MoM decline in lodging away from home, the largest drop in over three years, while the rent of primary index index increased 0.3% MoM and owners’ equivalent rent was up 0.4% MoM.
- If we remove the shelter and used car moves from the core CPI reading, prices were unchanged in the month of March for the first time since May 2024. On an annual basis, this special aggregate decelerated from 2.2% YoY in February to 1.8% YoY in March, the lowest in four years.
The soft March CPI print is evidence that weaker discretionary spending is flowing through into prices. Food and housing prices looked like the hottest segments this month while there were declines in discretionary segments like recreation goods and airfare and notable soft prints in recreation services (+0.1% MoM) and household furnishings (0.0% MoM). This is the kind of report that the Fed was looking for in its fight against inflation as it is evidence of demand-driven disinflation. Instead, over the last two years there was a steady strength in the economy that kept inflation sticky.
There is a major caveat to this report in that it is the last CPI reading before the major reciprocal tariffs went into effect and probably too early of a reading to see any impact from the tariffs placed on Mexican and Canadian imports. The impact from the North American tariffs was always going to be limited because most of these imports from the US’s neighbors are for intermediate goods like energy, lumber, and machinery. Autos is the main exception here and new vehicle prices did increase 0.1% MoM, the largest so far in 2025.