


US CPI: February 2025
| Indicator | February | Forecast | January |
|---|---|---|---|
| CPI | 0.2% MoM (2.8% YoY) | 0.3% MoM (2.9% YoY) | 0.5% MoM (3.0% YoY) |
| Core CPI | 0.2% MoM (3.1% YoY) | 0.3% MoM (3.2% YoY) | 0.4% MoM (3.3% YoY) |
| Energy | 0.2% MoM (-0.2% YoY) | - | 1.1% MoM (1.0% YoY) |
| Food | 0.2% MoM (2.6% YoY) | - | 0.4% MoM (2.5% YoY) |
| Core Goods | 0.2% MoM (-0.1% YoY) | - | 0.3% MoM (-0.1% YoY) |
| Core Services | 0.3% MoM (4.1% YoY) | - | 0.5% MoM (4.3% YoY) |
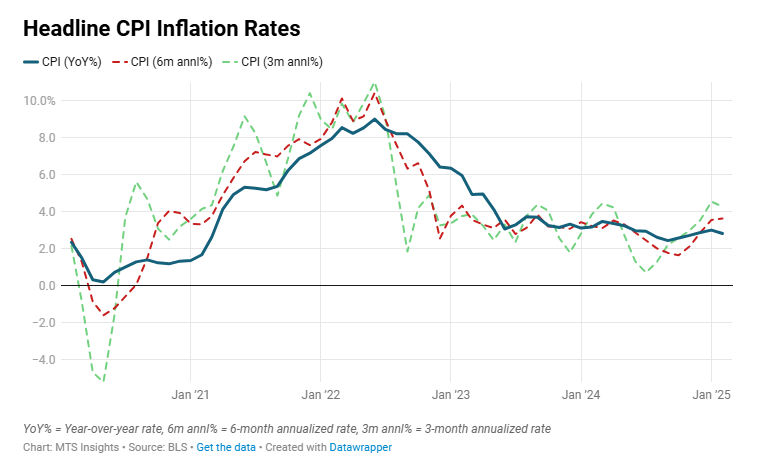
The major CPI inflation rates surprised to the downside across the board as February’s report looks like solid evidence that softness in consumer demand has allowed disinflation to continue. The headline CPI index increased 0.2% MoM and 2.8% YoY, falling short of expectations of increases of 0.3% MoM and 2.9% YoY. The core CPI index was also up 0.2% MoM and the annual rate was 3.1% YoY, both also short of expectations of 0.3% MoM and 3.2% YoY increases. However, softness in the volatile categories and declines in a few major categories were the main reason for cooler inflation.
Food and Energy
Both the volatile components of energy were under control in February and saw monthly rates that were lower than all months in Q4 2024.
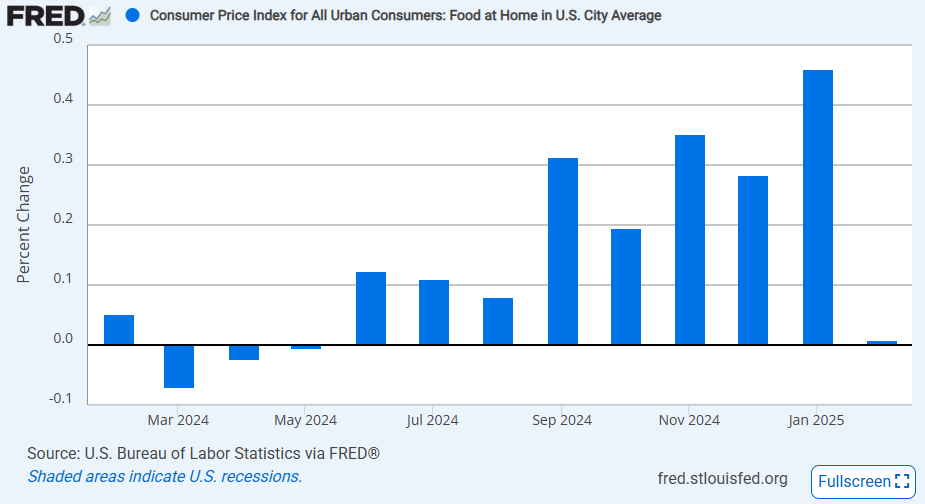
- Food prices were only up 0.2% MoM in February with food at home flat on the month and food away from home up 0.4% MoM. The flat monthly rate for grocery prices was the lowest since May 2024 and an important reversal from the gradual acceleration in MoM rates since late summer 2024. This softer reading did not include the recent decline in egg prices as the egg index was reported to have been up 10.4% MoM and 58.8% YoY in February. The decline in this index in March should mean that next month’s food at home print will be soft as well.
- Energy prices posted a soft 0.2% MoM increase after seeing larger increases in December and January. The annual rate is still slightly negative at -0.2% YoY meaning that we are still getting a slight deflationary impact from energy on the headline annual rate. Gas prices fell -1.0% MoM as the late winter rise was lower than usual. On the other hand, natural gas prices were up 2.5% MoM and electricity prices grew 1.0% MoM.
Core Inflation
The soft 0.2% MoM core inflation print allowed for a decline in the annual rate by -0.2 ppts to 3.1% YoY in February. This is the first deceleration in the annual rate since September as inflationary pressures had been making a come back in the second half of 2024. From January, both core goods and core services indexes cooled, but there was some divergence in the details:
- Core goods prices were up 0.2% MoM in February, and the annual rate was unchanged at -0.1% YoY which means that in general goods inflation is still making a slight negative contribution. A large reason for the coolness in February was a -0.2% MoM decline in new vehicle prices, the category with the highest weight. This offset moderately high increases elsewhere including used cars up 0.9% MoM, apparel up 0.6% MoM, and tobacco & smoking products up 0.6% MoM.
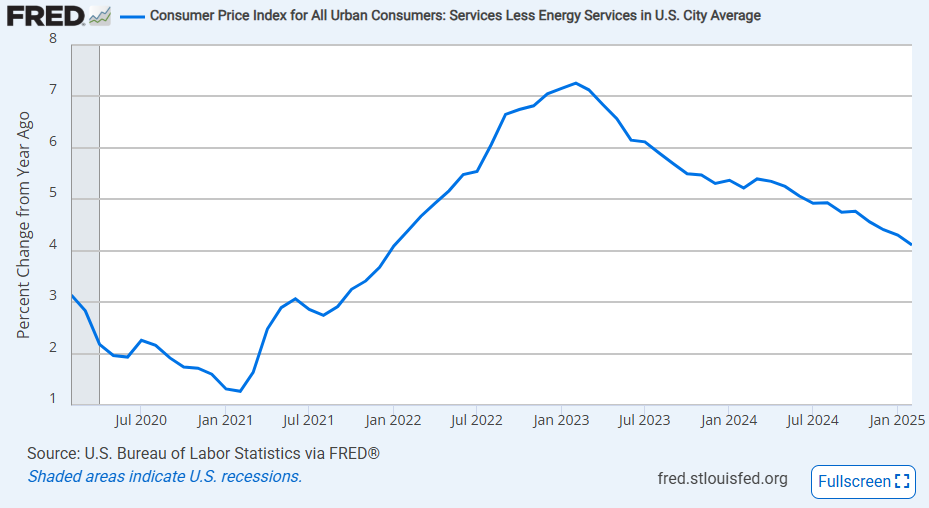
- Core services prices increased 0.3% MoM in February after a hotter 0.5% MoM increase in January. This caused the annual rate to fall to 4.1% YoY, down from 4.3% YoY previously and the lowest since January 2022. The coolness in services prices was caused by an -0.8% MoM decline in transportation services, reversing from the hot 1.8% MoM increase in January, as a result of airline fares falling -4.0% MoM. Some smaller services indexes were a bit hotter like recreation services (+1.0% MoM) and other personal services (+0.9% MoM).
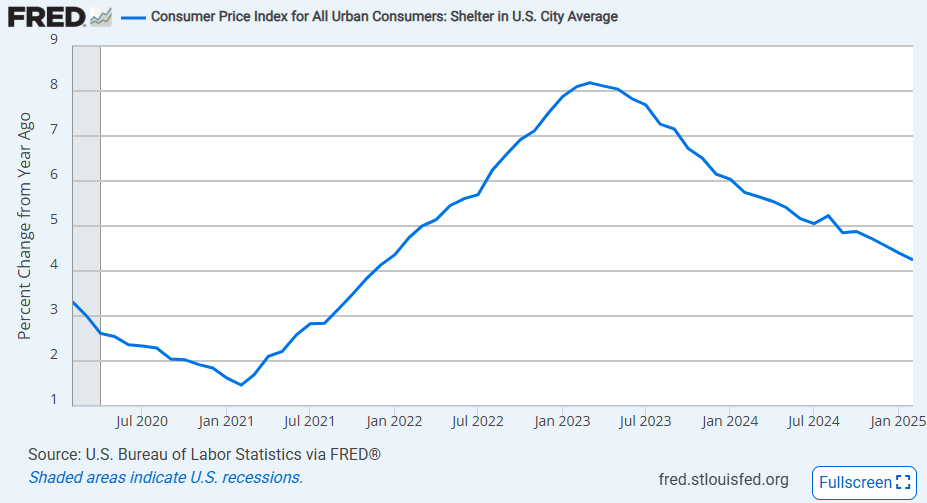
- The shelter index was up 0.3% MoM in February, down from 0.5% MoM in January, but still a moderate increase. Both rent and owners’ equivalent rent were up 0.3% MoM. Despite the moderate increases in shelter costs, the annual rate eased roughly -0.2 ppts to 4.2% YoY, the lowest since December 2021.
The details of the inflation data suggest that price changes were more mixed across categories, but subindexes with heavier weights posted softer readings and, thus, showed in the headline indexes more. Specifically, the new car index was down -0.1% MoM, and the transportation services index was down -0.8% MoM. Together, these subcomponents actually account for over 10% of CPI and cover a narrow subsection of consumer prices covering travel. A softer February reading was also helped by the shelter component, with a weight of over 35%, moderating to just 0.3% MoM.