


US CPI: January 2025
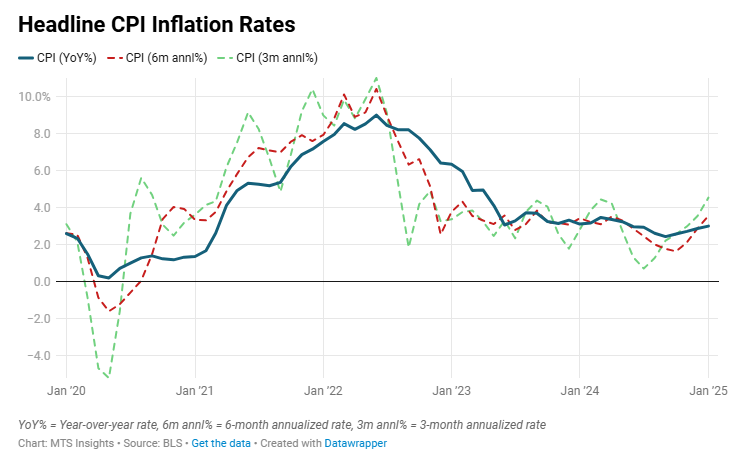
US CPI crashed in with a hot January reading this morning, beating analyst expectations across the board. CPI inflation was 0.5% MoM and 3.0% YoY in January, hotter than 0.3% MoM and 2.9% YoY expected, and core CPI inflation was 0.4% MoM and 3.3% YoY, also hotter than 0.3% MoM and 3.1% YoY expected. This was the largest monthly increase in the headline index since August 2023 and the first time the annual rate was at or above 3.0% since June 2024. In general, these numbers are strong evidence against any disinflationary narrative.
Food and Energy
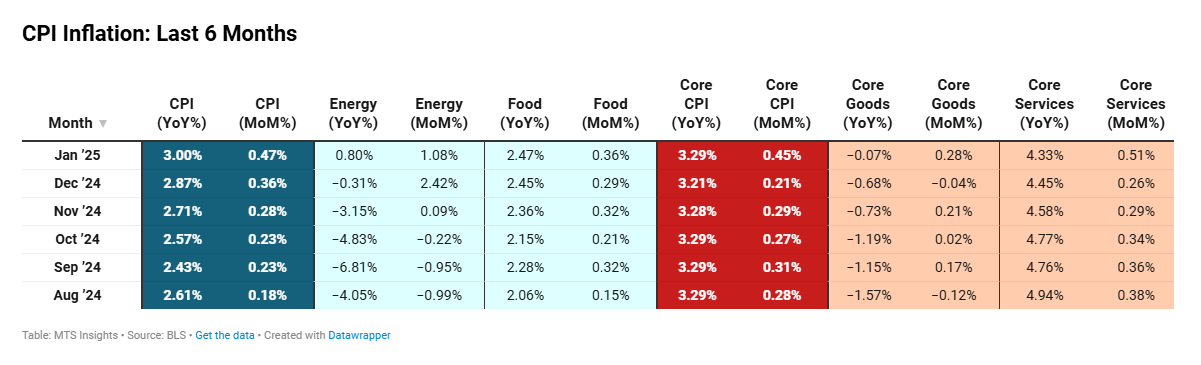
The hot headline inflationary read was a result of food and energy inflation flaring up to start the new year.
- The food index increased 0.4% MoM, the largest since February 2023, as the food at home index saw a strong increase of 0.5% MoM, the largest since October 2022. The driving upward force was a 1.9% MoM increase in meats, poultry, fish and eggs that, when digging deeper, was affected by a 15.2% MoM increase in egg prices (largest since June 2015). The BLS notes that the surge in egg prices accounted for about 2/3rds of the food at home increase. This is the first time we are seeing a huge impact from the bird flu pandemic which has affected over 23 million birds, including commercial egg laying birds, in the last 30 days.
- The energy index saw a strong increase for the second month in a row at 1.1% MoM (after 2.4% MoM in December). On an annual basis, the index is no longer a deflationary force as it is up 1.0% YoY in January vs -0.5% YoY in December. Gains in natural gas prices (+1.8% MoM) and gasoline prices (+1.8% MoM) drove the index higher. Energy prices could continue to see upward pressure from tariffs (specifically on Canadian oil) and rising natural gas prices from outsized inventory draws.
Core Inflation
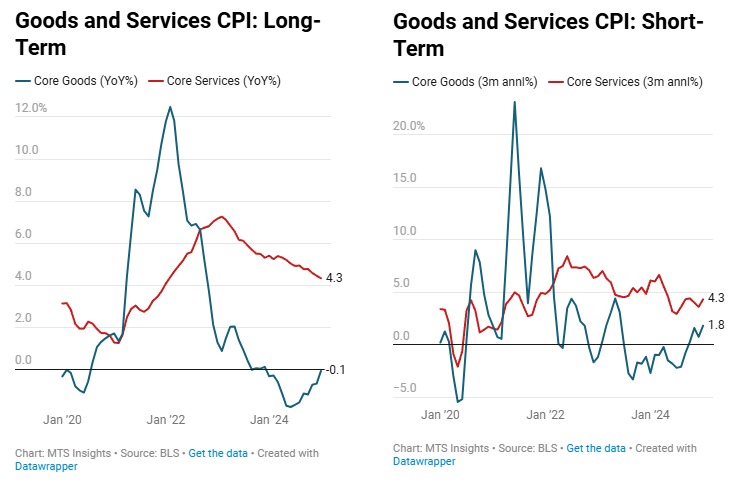
In January, we did not only see hot readings in the volatile food and energy indexes but also in core inflation segments. Core CPI’s 0.4% MoM increase was above expectations and was the highest since March 2024.
- Non-energy goods prices posted a 0.3% MoM increase as they rebound from a year of cooler months. The monthly increase was actually the highest since May 2023 and followed six months which included 2 negative readings and 2 flat readings. Quite simply, a rebound in goods prices is being made possible by a persistent strength in consumer demand that has been accentuated by rate cuts at the end of 2024.
- Just like in energy, we are seeing used vehicle prices flip from being a deflationary segment to a slight inflationary segment after a hot 2.2% MoM increase in January, the largest since May 2023. The annual rate flipped from -3.3% YoY in December to 1.0% in January and, with transport having a strong weight, the segment will put new upward pressure on core inflation.
- The other segment putting upward pressure on goods prices was medical care commodities, up 1.2% MoM as prescription drug prices increased 2.5% MoM. Outside of that, though, other goods indexes were cooler like apparel (-1.4% MoM) and household furnishings (-0.2% MoM).
- The services index increase of 0.5% MoM reverses some of the hope that we were going to see a solid disinflationary trend in services prices. Thanks to base effects, there was a slowdown in the annual rate from 4.4% YoY in December to 4.3% YoY in January, however, the short-term price pressures will likely see more of the attention.
- Starting with some good news, the shelter index increased 0.4% MoM, and the annual rate eased from 4.6% YoY in December to 4.4% YoY in January, the lowest since December 2021. There does appear to be a gradual disinflationary trend in shelter, and that is good news.
- With shelter coming in relatively cool, other services segments fueled the rise in core services prices. Transportation services, up 1.8% MoM (the largest since September 2022), was one of the hot segments in services as strong increases in car rental costs (+1.7% MoM), motor vehicle insurance (+2.0% MoM), motor vehicle fees (+2.6% MoM), and airline fares (+1.2%) played a part.
- Also within services, we see the effects of Netflix raising its prices. Recreation services prices were up 1.4% MoM with cable, satellite, and live streaming service (+1.8% MoM) seeing the largest monthly increase since August 2005.
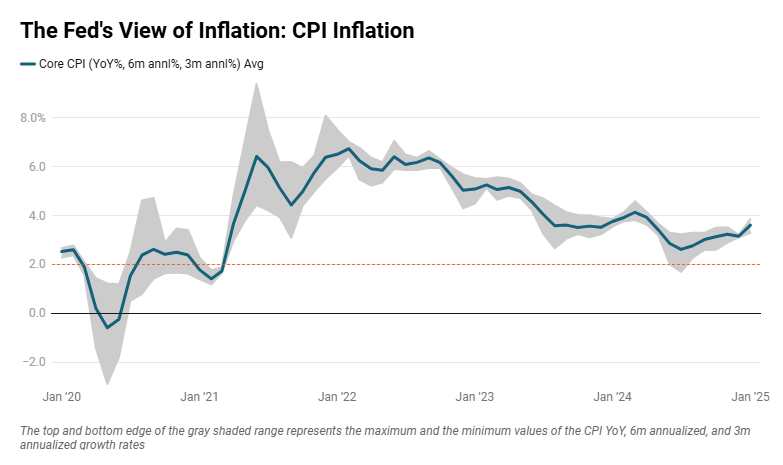
Overall, it’s hard to see any evidence in the January CPI data that there is a broad disinflationary trend that is moving inflation “sustainably” towards the Fed’s 2% target. Several categories came in with very hot monthly readings which overlooked the key disinflationary trend in the shelter index. What’s worse is these numbers represent prices before any tariffs were implemented which means we still have to wait for that factor to play out.
January 2025 Seasonal Adjustment Update
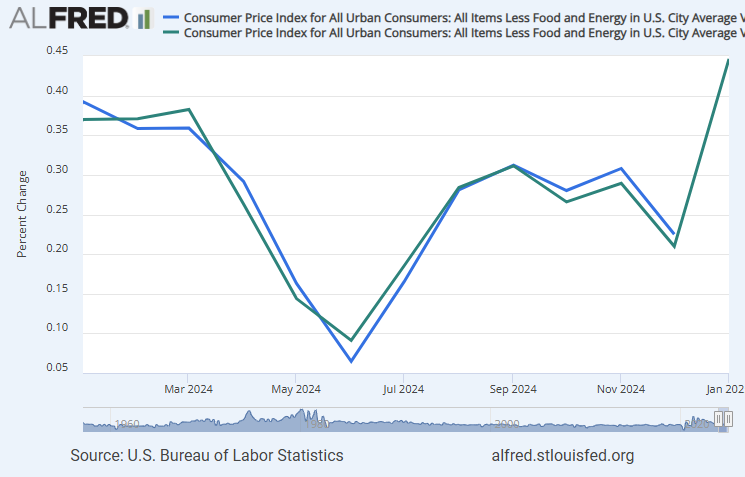
The January 2025 release also included an adjustment of the seasonal factor which caused some revisions to the 2024 monthly rates. In the chart above, the blue line represents data as of the December 2024 report, and the green line represents data as of today’s report, after the new seasonal adjustment update. The revisions did not change the directionality of any readings but instead just flattened out the trend over the year. Specifically, the low June rate saw a minor upward revision and the three Q4 readings were all revised slightly lower. This results in a slightly lower seasonally adjusted annual rate of 3.214% YoY in December vs the old estimate of 3.248% YoY, a very marginal downward revision that won’t have any policy implications.