


US PPI: March 2025
Following the cold CPI release yesterday, the headline PPI fell more than expected in March, recording the largest decline in more than a year. The final demand indexes were heavily affected by energy prices and softening consumer demand, with little impact from tariffs. On the other hand, the intermediate demand indexes did show evidence that higher import duties have already pushed up costs in the early stages of the supply chain.
Headline PPI
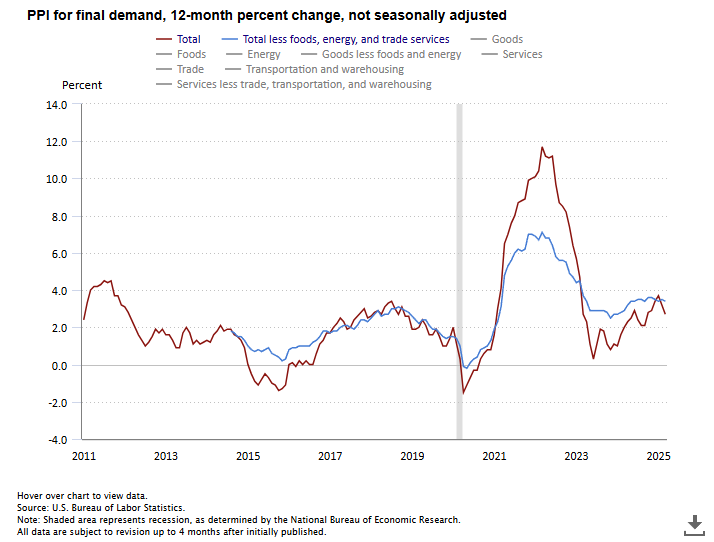
The headline PPI recorded a decline of -0.4% MoM in March, well below expectations of an increase of 0.2% MoM and the largest decline since October 2023. The annual rate of the index cooled for the second straight month, down to 2.7% YoY, the lowest since September 2024. The decline in the index was driven by two segments:
- Just as we saw energy have a significant impact on the CPI release yesterday, the energy index played a major role in the PPI release. The final demand energy index was down -4.0% MoM in March and, like the headline MoM move, it was the largest decline since October 2023. The BLS points out that “over three-fourths of the March decline is attributable to [the] -4.0% drop in the index for final demand energy.” More specifically, it attributes two-thirds of the decline to the -11.1% MoM drop in gas prices.
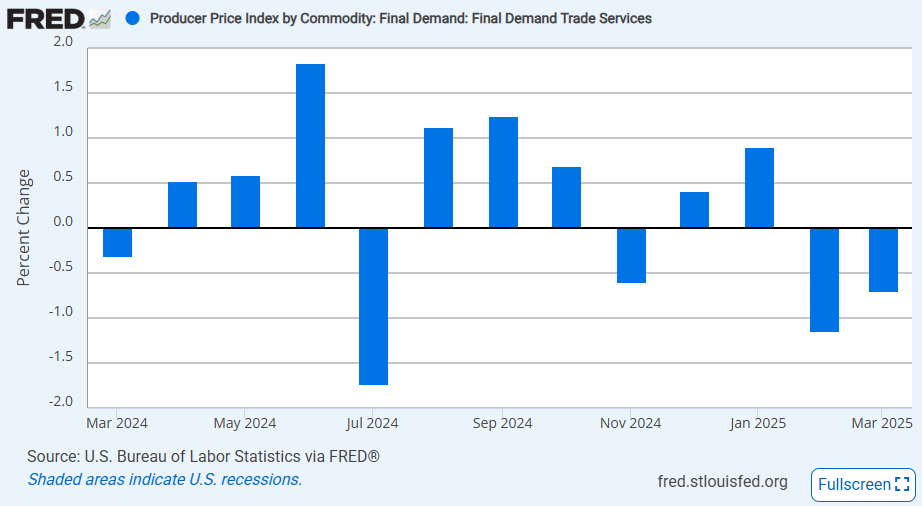
- Within the services PPI segment, there was a large decline in the index tracking trade services (-0.7% MoM) which is associated with margins in wholesale and retail trade. This followed a large -1.1% MoM decline in February and caused the annual increase to fall to 3.1% YoY, the lowest since November 2024. The margin compression in March likely came as a result of the decline in consumer prices in March and doesn’t necessarily point to a decline in costs for producers.
Final Demand PPI
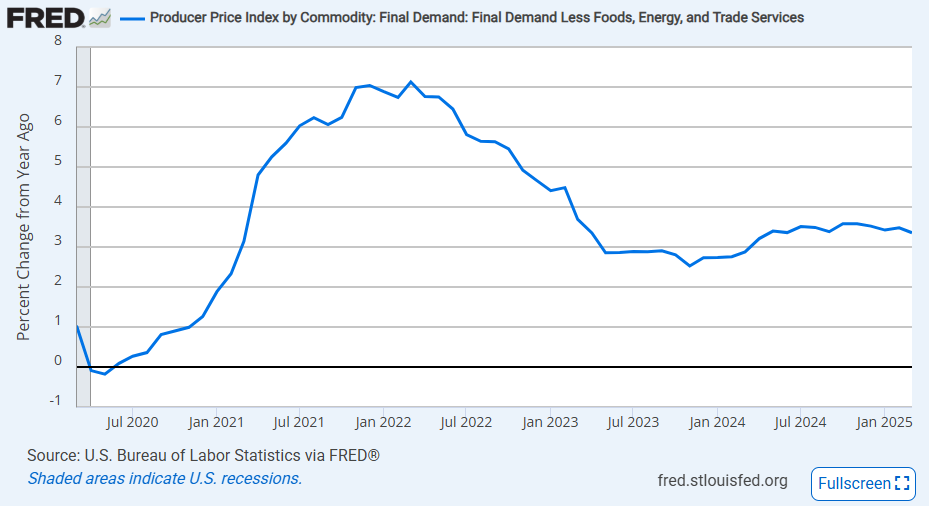
While the energy and trade services indexes played a major role in the decline in the PPI index in March, cost growth broadly was soft. Final demand PPI excluding foods, energy, and trade services was only up 0.1% MoM in March, slowing from three straight increases of 0.4% MoM. On an annual basis, the aggregate was up 3.4% YoY, down from 3.5% YoY and the lowest since June 2024.
One of the softest final demand segments in March (not including energy and trade services) was transportation and warehousing services. It fell -0.6% MoM, the largest decline since August 2024. The drop was caused by a large -3.9% MoM move in passenger transportation costs that is similar to the drop in airfares seen in the March CPI report. This was partially offset by a rise of 0.5% MoM in the cost of transporting foods which has a slightly higher weight. It’s likely that the decline in passenger transport costs was a result of lower fuel costs and weaker demand for travel as consumers backed off of discretionary spending.
Did the early tariffs on Canada, Mexico, and China impact the final demand indexes? It doesn’t look like there was much of a reaction. The March data for final demand appears to have been more impacted by the weakness in consumer prices and consumer spending. This is most strongly supported by the move in trade services PPI. It is possible that the slight rise in goods transport and warehousing costs may be an early reflection of tariff costs entering the supply chain, but that is unclear.
Intermediate PPI
While the final demand indexes did not show much of an impact from the early tariffs, there were more interesting moves in the intermediate PPI indexes. These indexes are different from the PPI readings that make the headlines as they show the change in costs earlier in the supply chain. Here are some intermediate segments to note in today’s release:
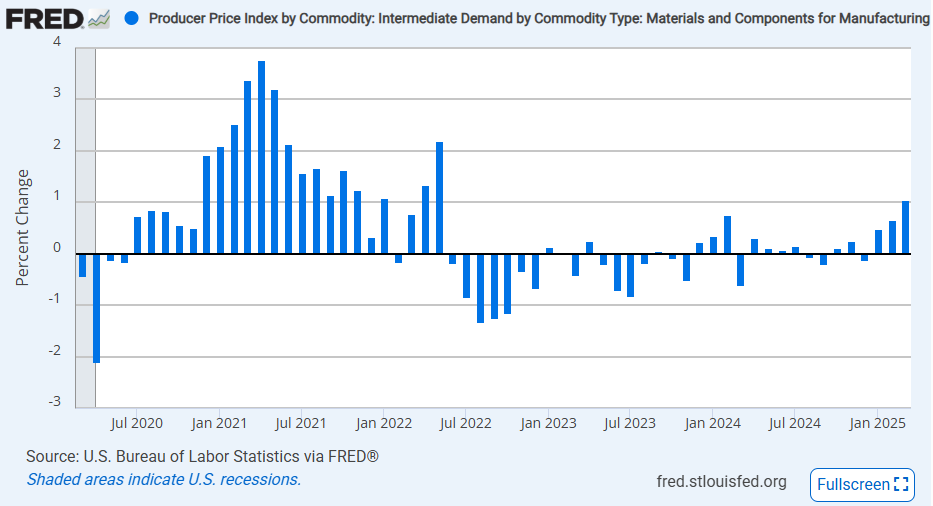
- The PPI for materials and components for manufacturing jumped 1.0% MoM in March, the largest monthly increase since May 2022. A string of strong increases in Q1 2025 sent the index up 1.3% QoQ, the highest since Q2 2022. The new trend in the last three months suggests that this increase is at least somewhat linked to tariffs. Within the index, materials for durable manufacturing increased 1.4% MoM in February and 3.1% MoM in March. These unusually high gains likely represent a sudden increase in costs for the materials needed for auto & other transport goods manufacturing.
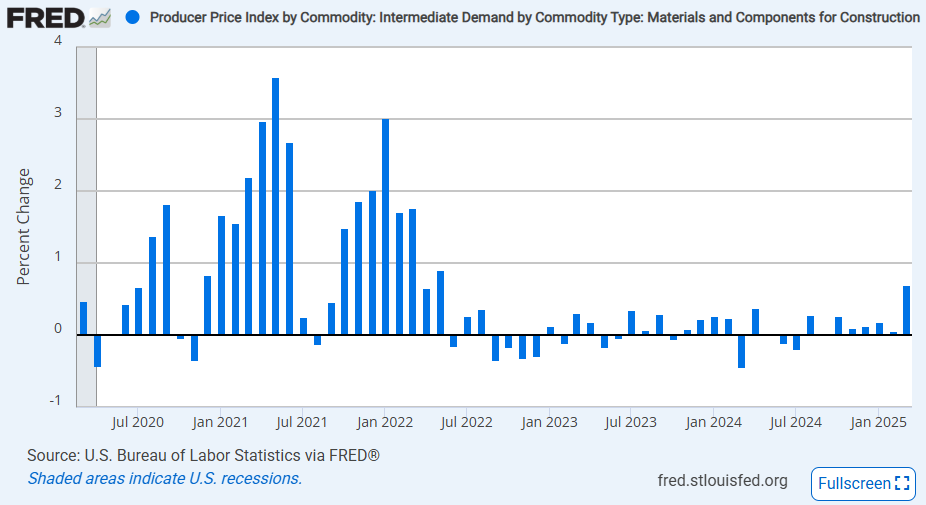
- Data for March suggested that there was also an increase in materials and components needed for construction. That index increased 0.7% MoM in March which is the largest rise since May 2022 as well. With Canada being a major source of lumber and Mexico a major source of gypsum, tariffs on these goods likely drove the increase seen here.
- The BLS discusses some of the details of the rise in intermediate processed goods costs: “Among prices for processed goods for intermediate demand in March, the index for steel mill products rose 7.1% MoM. Prices for structural, architectural, and pre-engineered metal products; primary basic organic chemicals; industrial electric power; and plastic resins and materials also moved higher.” These were all offset by a -11.1% drop in gasoline prices.
| Goods Inputs PPI by Production Stage | Inputs for Goods Producers | Inputs for Services Producers |
|---|---|---|
| Stage 1: Goods (ex-Food, Energy) | +1.3% MoM | +0.4% MoM |
| Stage 2: Goods (ex-Food, Energy) | +0.8% MoM | +0.2% MoM |
| Stage 3: Goods (ex-Food, Energy) | +1.5% MoM | +0.8% MoM |
| Stage 4: Goods (ex-Food, Energy) | +0.5% MoM | +0.3% MoM |
The BLS breaks down PPI for intermediate goods by production stage. This breakdown shows that the largest increase in costs was earlier on in the supply chain (stage 1 is the earliest, stage 4 is closest to final demand), and demonstrates the early impact of tariffs on US producers. It’s likely that these costs will continue to be pushed down the supply chain and eventually reach consumers.