


US PPI: February 2025
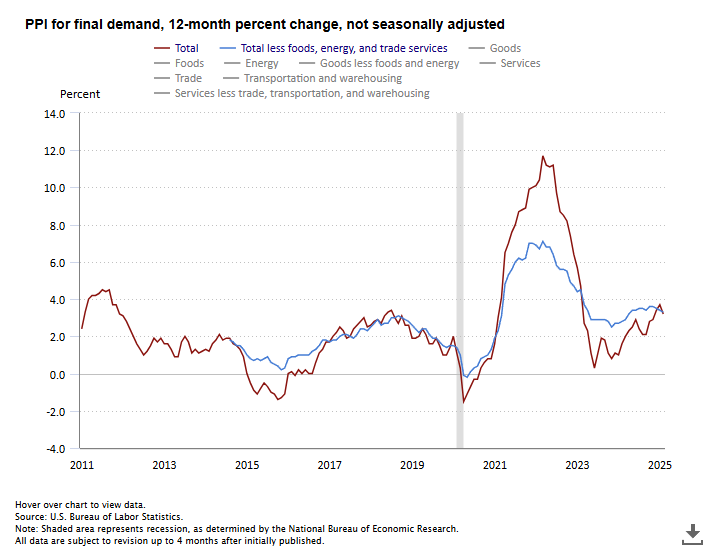
US PPI growth came in soft in February after a cool CPI report suggested that inflationary pressures were abating at the beginning of the year. The headline PPI index was flat on a monthly basis in February and up 3.2% YoY, well below expectations of a 0.3% MoM increase. Core US PPI, which excludes food and energy, was down -0.1% MoM and up 3.4% YoY, below the 0.3% MoM increase that was expected. The soft readings were helped by a decline in energy prices, a reversal of the increase in trade services costs in January, and moderating services costs from diminishing macro conditions. However, these were offset by an increase in core goods, especially food (egg) prices.
Goods
The goods segment of PPI was mixed with large swings in the volatile category paired with a moderate increase in the core segment. Overall, final demand for goods prices increased 0.3% MoM, the lowest in four months.
- Producer prices for foods jumped 1.7% MoM in February, building on a 1.0% YoY increase in January. The segment was largely impacted by producer prices for eggs which actually surged 53.6% MoM in February and ended up accounting for about two-thirds of the February monthly gain in goods PPI. The bird flu also had an impact on turkey prices which were up 8.6% MoM in February, but the impact was much weaker. Outside of eggs and turkeys, food PPI was pretty mixed.
- Offsetting the rise in foods was a drop in energy PPI of -1.2% MoM in February after two months of strong monthly increases. The biggest impact was in the gasoline index which fell -4.7% MoM and -8.2% YoY, and adding to that was a -9.8% MoM decline in the home heating oil index as costs receded after an unusually cold January. Energy costs are now down -3.7% YoY on the year, with the only major upward pressure being natural gas prices which are being pushed higher due to low inventories.
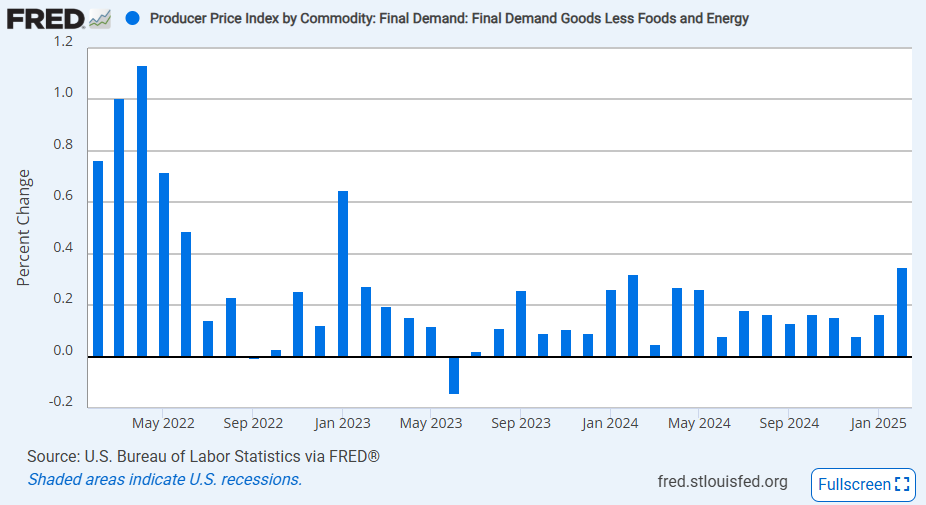
- Goods PPI excluding energy and goods was up 0.4% MoM which is actually the largest monthly increase since January 2023. The largest monthly increase was in iron and steel scrap, up 8.6% MoM, as it bounced back from three straight monthly declines. Producer prices for cigarettes (+2.6% MoM) and jewelry (+2.4% MoM) also saw sizeable increases with both goods up over 10%+ on an annual basis.
Overall, the move in goods producer prices was a little hot and may have generally been impacted by the expectations that tariffs are going to increase prices in the near future. The index of personal consumption goods excluding energy posted a strong monthly gain of 1.1% MoM and was up 4.0% YoY suggesting there is likely to be some upward pressure on CPI in the coming months. It looks like tariffs will remain in place for all of March, so we will also see how PPI reacts in the next report. The key exception is that the effects of the bird flu are likely to wane as we have already seen spot egg prices peak in March. Thus, food PPI will be much cooler.
Services
The surprise in the PPI report came on the services side. Final demand for services PPI actually fell -0.2% MoM in February, the lowest monthly print since July 2024. This caused the annual rate to slow to 3.9% YoY after it had accelerated to 4.4% YoY in January. The decline looks to have been driven by trade costs dropping after a rise in January as firms tried to get ahead of tariffs.
- The trade services PPI was down -1.0% MoM in February, reversing from a 1.2% MoM gain in January. Several subsegments followed this trend: machinery and vehicle wholesaling (Jan: +4.9% MoM, Feb: -1.4% MoM), food and alcohol retailing (Jan: +2.8% MoM, Feb: -2.0% MoM), automobiles retailing (Jan: +3.6% MoM, -3.8% MoM), furniture retailing (Jan: +4.8% MoM, Feb: -4.3% MoM), and major household appliances retailing (Jan: +1.2% MoM, Feb: -6.0% MoM). In fact, the BLS notes that the decline in machinery and vehicle wholesaling costs accounted for over 40% of the overall services move. If tariffs do remain in place, costs should go back to increasing as firms look to pass on the tariff charges down the supply chain.
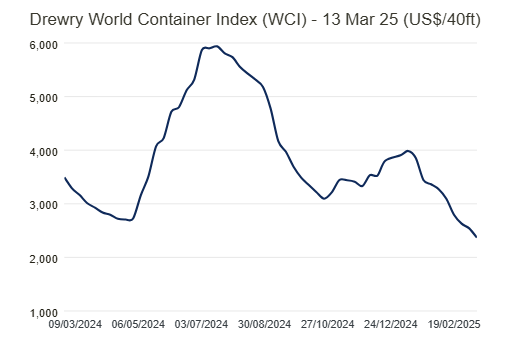
- Transportation and warehousing costs were flat in February due to softness across all segments of freight. Trucking (-0.1% MoM) and air (-1.2% MoM) freight costs were lower and rail freight costs were unchanged. The slowdown in global trade, especially US trade, is causing this decline in freight costs as seen in Drewry’s reports on container rates which note that ports are noting spare shipping capacity from weaker macro conditions globally and volatile US trade policy. This is also helped indirectly by lower fuel costs which was shown through the trend in energy PPI.
- Non-trade, non-transport services PPI was up 0.2% MoM, a moderate monthly increase that is consistent with a trend of a gradual easing in service sector activity. A decline in bond rates caused a notable -2.5% MoM decline in consumer loan costs after they had jumped 2.9% MoM. Investment services costs also fell, down -0.8% MoM and were down -0.6% YoY. There was also a large -4.0% MoM decline in car rental services costs which was a reversal of two months of gains.
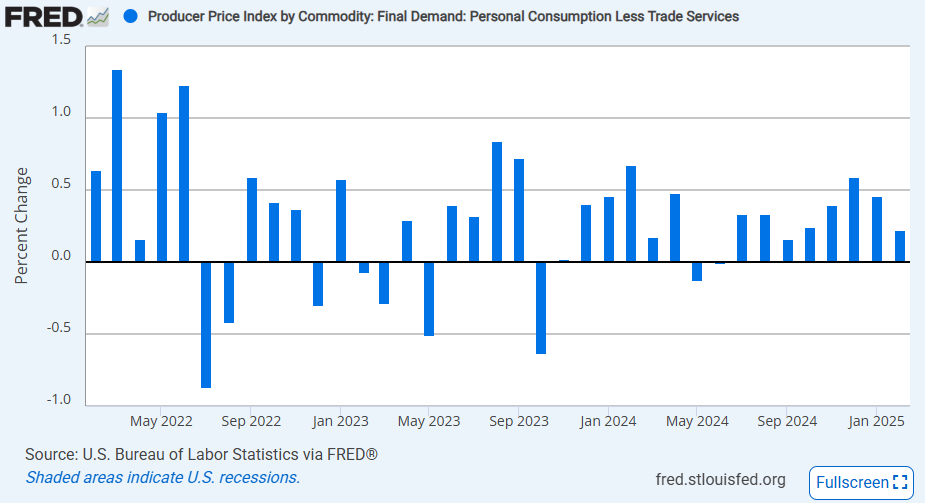
The services component of PPI was heavily impacted by the unusual flow of trade in January and a sense that macro conditions are starting to deteriorate. The index tracking personal consumption services (ex-trade services) posted its lowest monthly increase since September 2024 as the recent period of hot readings has come to an end. Will this flow further into lower services CPI? That remains to be seen. The index is still up 3.3% YoY but is trending in the right direction.