


US Employment Situation: March 2025
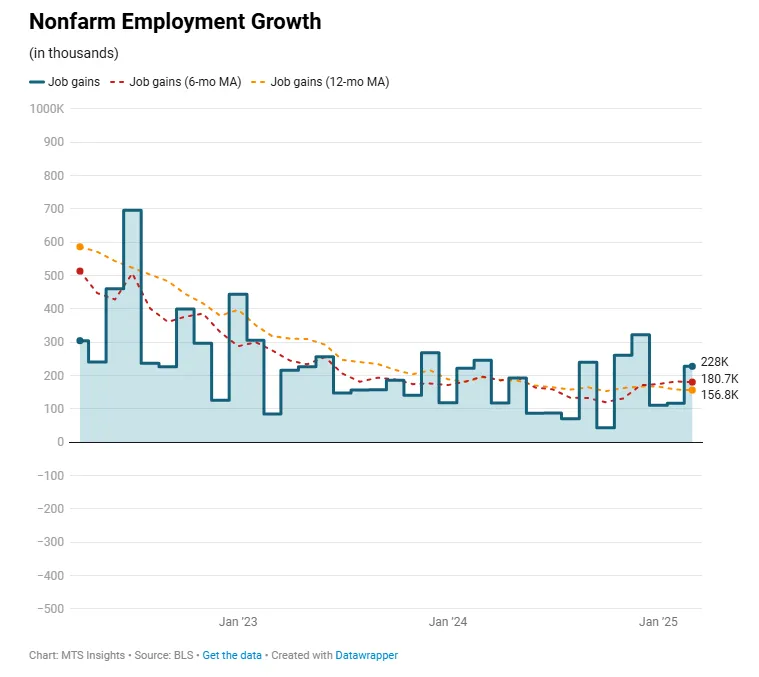
Amidst heightened uncertainty surrounding tariff policy and rising recession risks, the US labor market remained relatively solid in March. A total of 228,000 jobs were added, above expectations and topping the pace of hiring in the first two months of the year. The unemployment rate did tick up to 4.2% unexpectedly, but a closer look suggests that the increase was insignificant. Despite the strength exuded by the March report, the focus has shifted to tariffs and how the US economy will react to them in the coming year.
Establishment Data
The US labor market showed a renewed momentum in March, with total nonfarm payrolls increasing by 228,000, beating expectations of a smaller 135,000 increase. Payroll growth last month was the largest so far this year, topping gains in the first two months, which were both revised down slightly (January revised down -14k to 111k, February revised down -34k to 117k). While hiring was stronger in March, the 3-month average still fell by over -30,000 to 152,000. Private employment growth also rebounded, up to 209,000 in March, but in a similar way, the 3-month average fell by about -25,000 to 135,000 to end the first quarter.
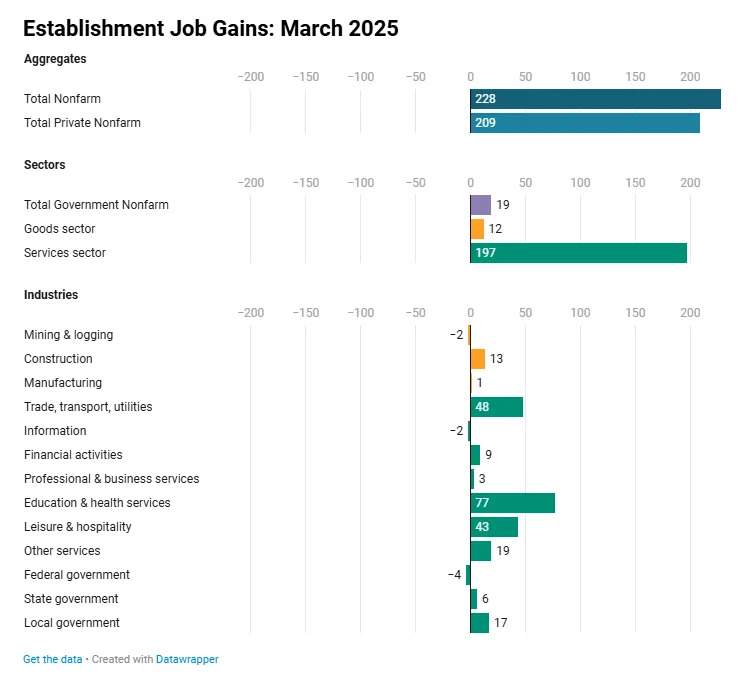
The details of the Establishment Survey reveal a sharp divergence between the goods and services sectors. The former added just 12,000 jobs in March, with the largest growth in the construction industry (+13,000). The manufacturing sector added just 1,000 in the month, partly offsetting the downward revision in manufacturing hiring of -2,000 to 8,000 in February. In the services sector, 197,000 jobs were added, led by the health care & social assistance industry, up 77,800. Other industries saw smaller gains like retail (+23,700), transportation & warehousing (+22,900), and leisure & hospitality (+43,000). The strength in the service sector is a good sign that services firms ended the quarter on a solid footing, bouncing back from two months if job growth under 100,000.
Alongside the rebound in private hiring was a bounce in government hiring as well. In March, the government sector added 19,000 jobs after only adding 1,000 last month (revised down from 11,000). The federal government continued dropping employment as DOGE had intended, landing at exactly 3 million after a decline of -4,000. Since January, federal government employment has fallen by -15,000. Employment in state and local governments continues to rise to offset the drop in federal payrolls. In March, they were up 23,000, with most of those coming in the state and local public education sector. DOGE is still not having a major effect on payroll data. While workforce cuts are planned for Q2 2025, I don’t expect them to be a significant source of concern for labor market conditions.
Household Data
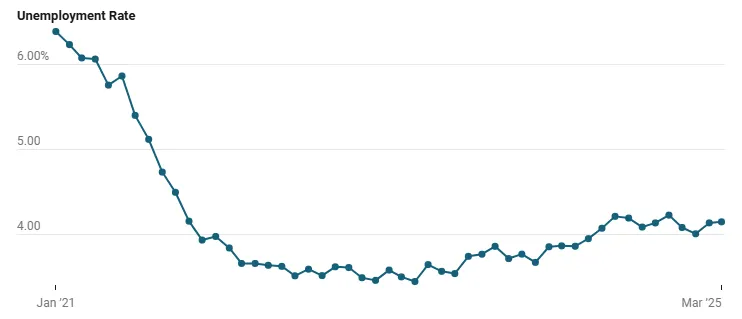
The headline of the Household data points will be the 0.1 ppt increase in the unemployment rate to 4.2% since it was above expectations, but looking at a few more decimal points shows that it was basically unchanged. Indeed, the unemployment rate actually increased just 1 bp from 4.14% to 4.15% in March. This makes sense because the raw values didn’t reflect a major increase in joblessness. The total number of employed actually increased by 201,000 while the unemployed population was only up 31,000. Importantly, we saw a large rebound in the labor force of 232,000 after the large -385,000 drop in February. The participation rate recovered 0.1 ppt to 62.5%, but that slight increase in unemployment meant the employment rate was unchanged at 59.9% (but it probably increased slightly if not rounded).
The detailed data confirms that the increase in the unemployment rate was really evidence of the job market weakening. Details on the reason for unemployment show that there was a 77,000 increase in those who were new labor force entrants while there were -3,000 fewer individuals who were unemployed because they lost their job, and -48,000 fewer who left a job. Additionally, within part-time workers, there was a drop of -136,000 who reported working part-time due to business conditions and an increase of 190,000 who were part-time for noneconomic reasons. One other detail to point out is that the unemployment rate increased the most for teenagers, rising 0.8 ppts to 13.7%, as this age group accounted for about 20% of the increase in the labor force. When looking at workers 25 years old or older, the unemployment rate actually fell -0.1 ppt to 3.3%.
Wage Data
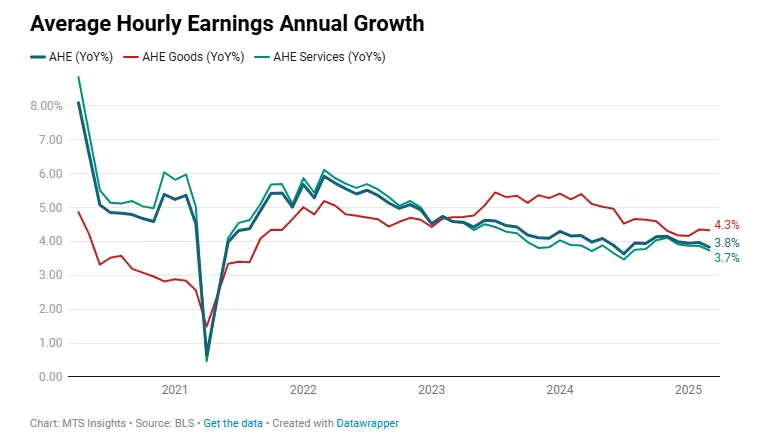
Headline wage growth data came in slightly softer than expected. Average hourly earnings across all industries were up 0.3% MoM and 3.8% YoY in March, falling from 4.0% YoY in February. The monthly rate was in line with expectations, while the annual rate was slightly below expectations of 3.9% YoY. There continues to be a gap between the two sectors. Goods sector wages grew 0.5% MoM and were up 4.3% YoY, while service sector wages were only up 0.2% MoM and 3.7% YoY. Notably, the annual increase in service sector wages was the softest since July 2024.
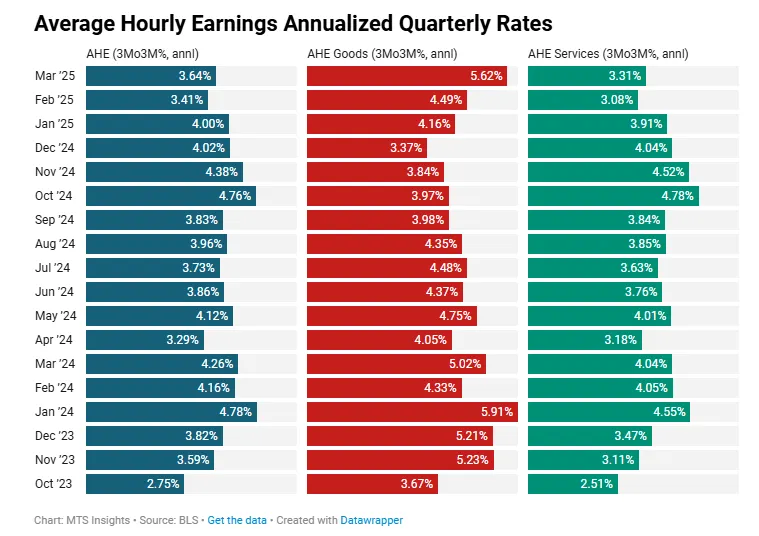
What sticks out in short-term wage pressures is a flare-up in the goods sector. Using the 3-month growth rate annualized, we can see that goods wages have increased at an annualized pace of 5.62% in the first three months of the year, the highest since January 2024. On the other hand, service wages increased at an annualized rate of 3.31% in Q1. Since the US economy is more heavily weighted in services, the weaker growth in services is keeping overall wage growth more subdued.
Stronger wage growth in the goods sector, particularly in manufacturing, where wages were up 0.7% MoM in March, could be a problem for firms. The introduction of tariffs on just about every country will put major upward pressure on nonlabor costs. If labor costs also continue to rise, goods firms’ profit margins will see some heavy pressure. In the end, this could be a setback for the Trump administration, which is trying to target growth in the manufacturing sector and an increase in manufacturing employment with its policies.