


US Employment Situation: January 2025
Once again, employment data presents another mixed report that leaves a lot of questions to be answered. Looking at the headline data points, the US added 143,000 jobs in January, below expectations of 170,000, and the unemployment rate edged down to 4.0% from 4.1% in December, also below expectations of the rate staying unchanged at 4.1%. The January report also came with significant revisions to employment data in both the Household and Establishment surveys. Let’s dive into this meaty release.
Establishment Survey
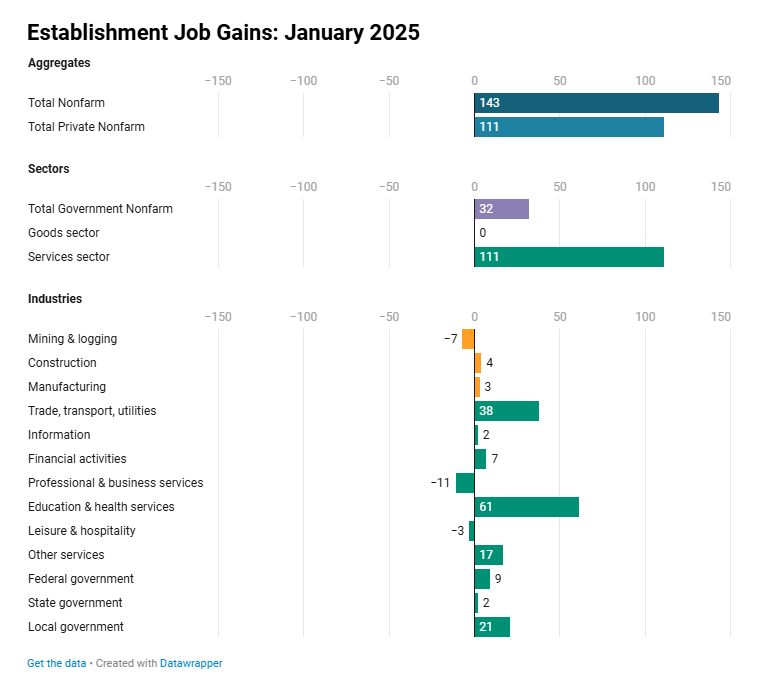
Firms slowed down their hiring to start the new year, adding 143,000 jobs in January which is a clear step back the monthly pace to end 2024. This was partly because there were strong upward revisions in jobs added in November and December totaling 100,000 (November revised up 49,000 to 261,000, December revised up 51,000 to 256,000). Private firms added a total of 111,000 jobs in January with all of the job additions coming from the service sector. The goods sector continued its sluggish run with no jobs added to start 2025 and just 26,000 added across the two final 2024 months. In the service sector, the leading industry was private education & health services, which added 66,000 jobs, and second to it was retail at 34,300. Other service industries were relatively weak like professional & business services at -11,000 and leisure and hospitality at -3,000. The last time both of these industries lost jobs in the same report was June 2024.
Despite the weaker January print, the pace of job gains over the last three months increased from 204,000 to 237,000 because the weak October print of 43,000 dropped out of the calculation. While job gains kept up a solid pace, total private average weekly hours worked fell by -0.1 to 34.1 which happens to be the lowest since March 2020 and before that the lowest since April 2010. While BLS claims weather in January did not have a “discernible effect” on the employment data, this drop in hours could have been driven by the disruptions caused by the LA wildfires and the exceptionally cold weather during the month.
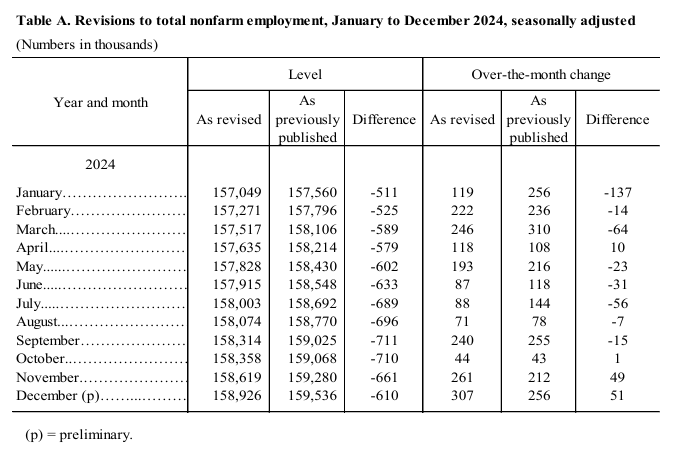
This report included the annual revisions to the Establishment data which ended up being significant. March 2024 total nonfarm employment was revised down by -589,000 to 157.5 million which pulls through to a -610,000 downward revision in the December 2024 employment total. This revision means that the over-the-year change in total nonfarm employment for March 2024 was revised from +2,900,000 to +2,346,000. These adjustments suggest that hiring strength has been slightly overstated for the year as many months are seeing substantial downgrades in the monthly changes. However, it’s important to note that the directionalities in all of the months remained the same, up, and that November and December were actually hot relative to other 2024 months. Thus, the assessment of a strong labor market does not change too much.
Household Survey
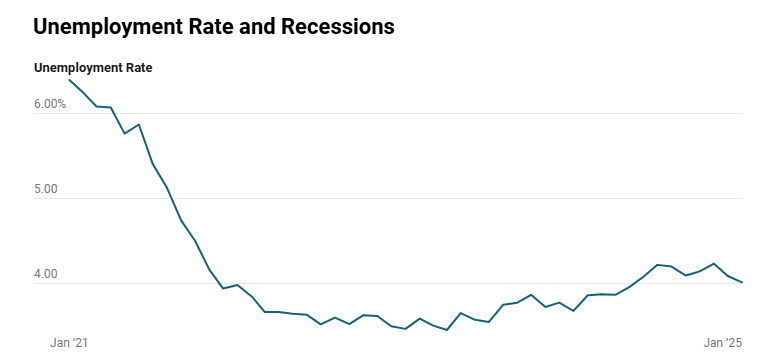
The unemployment rate in January was measured at 4.0%, the lowest since May 2024 and tighter than analysts’ expectations which forecasted the rate to remain at 4.1%. The decline in the unemployment rate came from a higher participation rate of 62.6% and a higher employment-population ratio of 60.1%, both up 0.1 ppts from December (change due to revisions). Outside of the rate comparisons over the month, there are fewer monthly changes that we can look at because of major updates to population estimates.
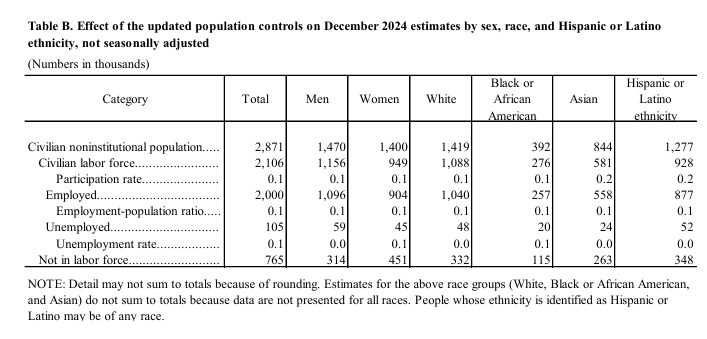
At the beginning of the year, the BLS updates its population estimates to include new information from the Census Bureau. The January 2025 update was substantial. The primary revision is an upward revision in the size of the civilian noninstitutional population aged 16 and over of 2.9 million that likely came as a result of an upward revision in the 2024 immigrant population. From this additional 2.9 million, BLS estimated that the civilian workforce increased by 2.1 million with around 2.0 million market as employment and 105,000 as unemployment. The remaining 765,000 were added to the population not in the labor force. The raw values did not affect the overall rates that much, ending with an increase of 0.1 ppts across the rates for unemployment, participation, and employment.
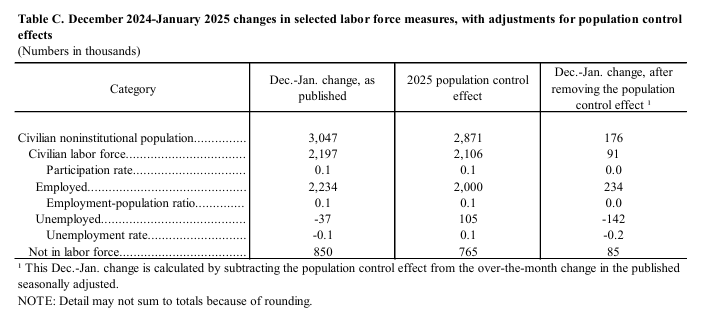
Removing the population estimates, we see that the unemployment rate change from December to January was actually a substantial -0.2 ppt drop as the number of employed increased by 234,000 and the total number of unemployed fell -142,000. This decline in unemployment looks to have come in the longer-term categories (15-26 weeks and 27 weeks and over) as there were declines for each from December to January, but it is difficult to make comparisons due to the revisions.
What do the updated population estimates mean for the labor market assessment?
- The large increase in employment helps to equalize the differences between the Establishment and Household data. It also suggests that the strength in hiring in 2024 was a result of net immigration and, more specifically, undocumented immigration which is likely to have been undercounted by the BLS.
- With the two datasets becoming more consistent, there is a clearer sense of the strength of US labor demand which is the base of the tight labor market. Something to consider is that the recent mass deportation efforts by the Trump administration may eventually impact the labor force and make conditions even tighter. These effects could show up as early as next month as Trump has moved fast on his immigration crackdown.
Average Hourly Earnings
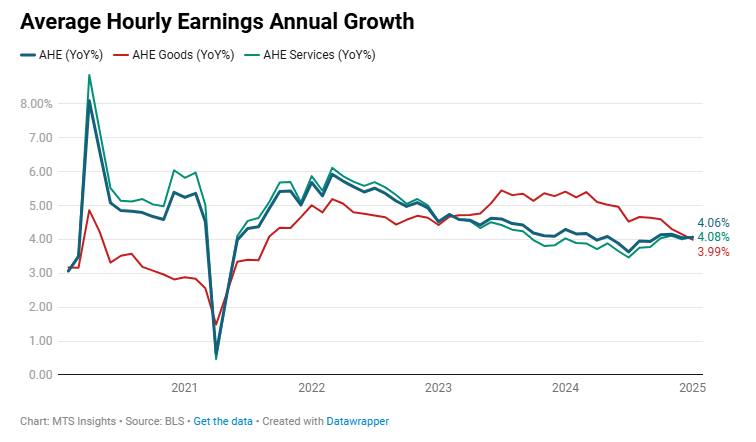
Average hourly earnings came in with a hot 0.5% MoM print in January, above estimates of a slower 0.3% MoM increase. The annual rate remained above four percent at 4.1% YoY, unchanged from an upwardly revised 4.1% YoY in December and well above expectations of a 3.8% YoY annual increase. Wage growth across the goods and services sector has now both closed in on the headline wage growth rate. Goods hourly earnings were up 4.0% YoY, easing from 4.2% YoY previously, while services hourly earnings picked up from 4.0% YoY to 4.1% YoY.
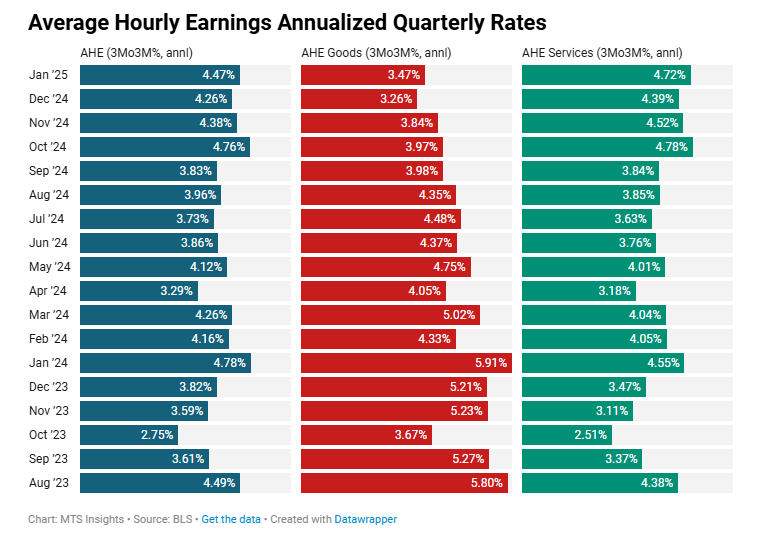
The hot January print has pushed short-term wage pressures to a more concerning level. The annualized quarterly rate of growth for average hourly earnings is now at a 3-month high of 4.47% after deceleration for two months from the high 4.76% reading in October. This is a result of wage pressures flaring up in the services sector, the main sector of the economy driving economic growth. Goods sector wage growth continues to be in a downtrend, but since the goods sector is a smaller part of the US economy, it has a smaller effect on overall wage growth.