US Retail Sales: January 2026
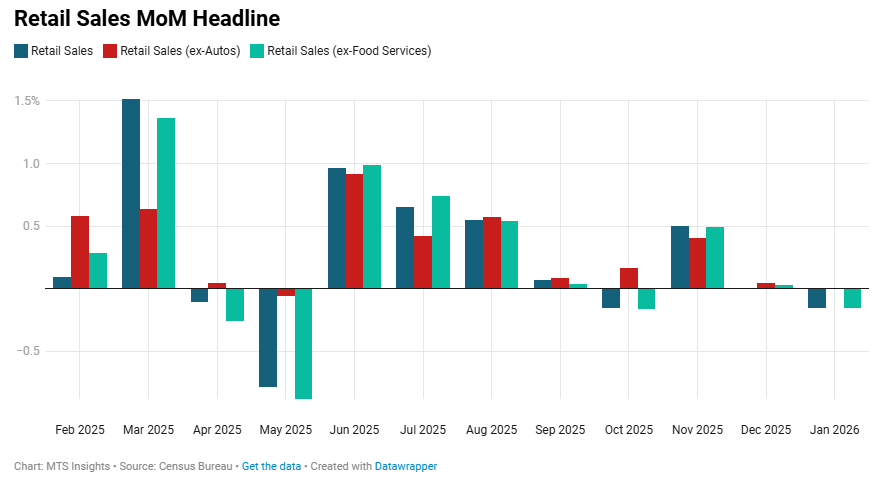
U.S. retail and food services sales fell -0.2% MoM but rose +3.2% YoY in January 2026 to $733.5 billion, indicating a modest monthly pullback following stable holiday-period spending.
-
Total retail and food services sales declined -0.2% MoM to $733.5B but increased +3.2% YoY, while sales for the November 2025 to January 2026 period were +2.9% higher than the same three-month period a year earlier.
-
Retail trade sales alone fell -0.2% MoM and increased +3.0% YoY, reflecting the broader softness across goods retailers during the month.
-
Sales excluding motor vehicles and parts were unchanged MoM and rose +3.9% YoY, while sales excluding gasoline stations increased +0.1% MoM and +3.7% YoY, showing steadier underlying retail spending once volatile categories are removed.
-
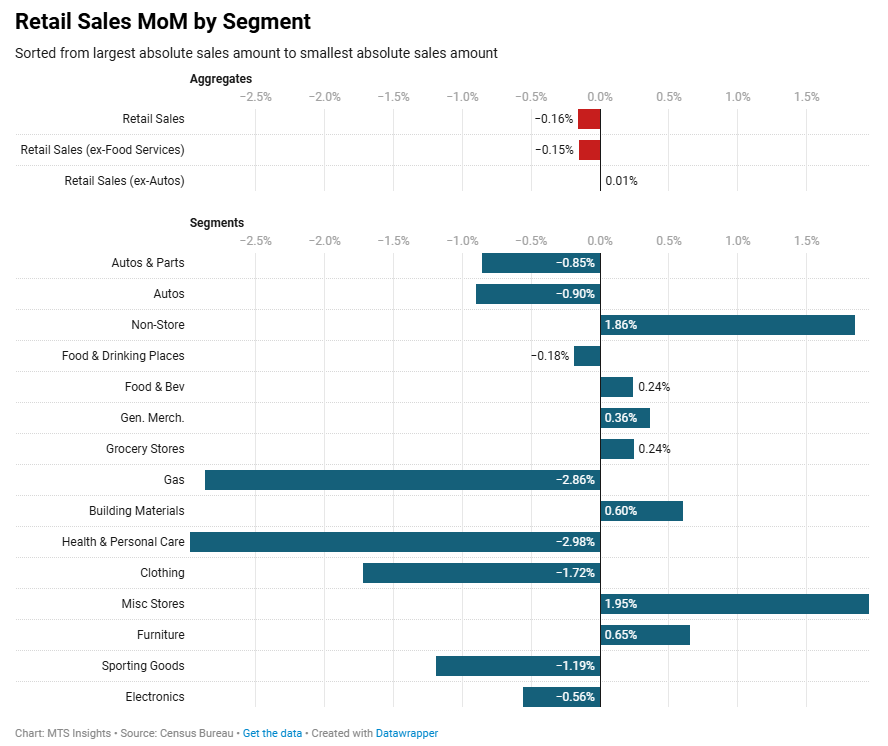
Motor vehicle and parts dealers saw sales fall -0.9% MoM and rise only +0.1% YoY, with auto and other motor vehicle dealers also declining -0.9% MoM and -0.2% YoY.
-
Gasoline station sales dropped -2.9% MoM and -3.7% YoY, marking the largest monthly decline among major categories and weighing on the headline retail figure.
-
Building materials and garden equipment dealers rose +0.6% MoM and +4.3% YoY, while food and beverage stores increased +0.2% MoM and +1.4% YoY, including grocery stores at +0.2% MoM and +1.5% YoY.
-
Several discretionary retail categories declined MoM, including clothing stores (-1.7% MoM; +3.0% YoY), electronics and appliance stores (-0.6% MoM; +2.0% YoY), and sporting goods, hobby, musical instrument, and book stores (-1.2% MoM; +3.2% YoY).
-
Nonstore retailers increased +1.9% MoM and +10.9% YoY, the strongest annual growth among major categories, while miscellaneous store retailers rose +2.0% MoM and +10.8% YoY.
-
Food services and drinking places declined -0.2% MoM but increased +3.9% YoY, indicating continued annual growth in spending at restaurants and bars despite the modest monthly dip.