
US Retail Sales
About
-
August 14th, 2026 · 8:30 AM
-
September 16th, 2026 · 8:30 AM
-
October 15th, 2026 · 8:30 AM
-
November 17th, 2026 · 8:30 AM
-
December 16th, 2026 · 8:30 AM
Charts & Data
Latest Releases
12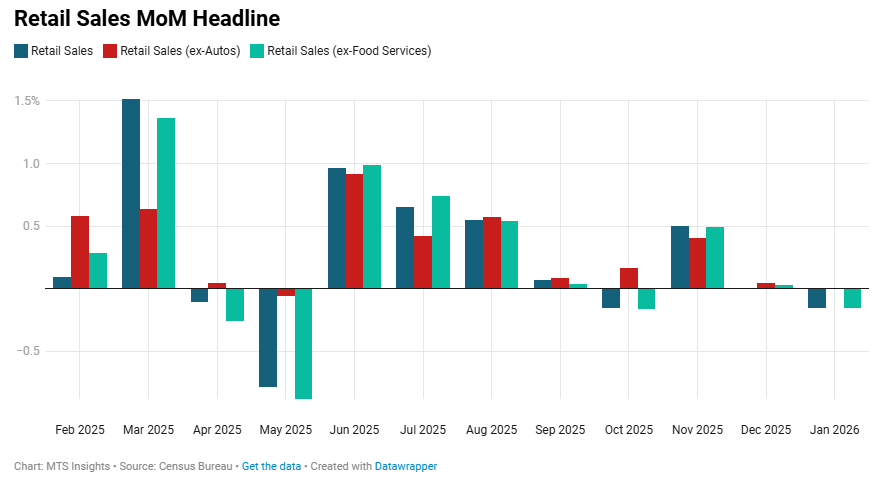
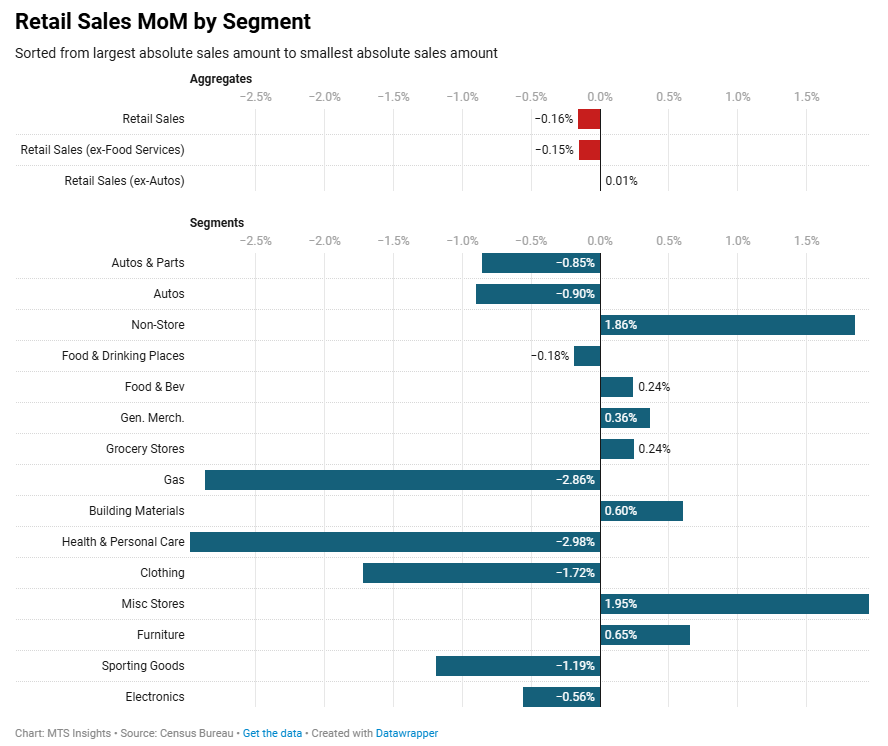
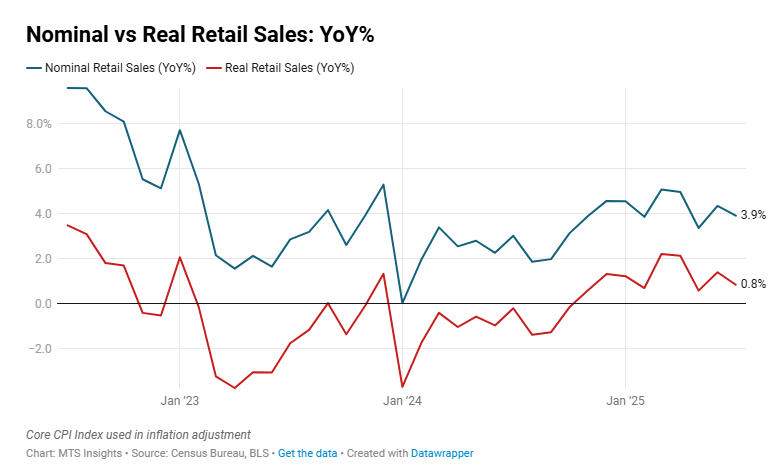
U.S. retail and food services sales fell -0.2% MoM but rose +3.2% YoY in January 2026 to $733.5 billion, indicating a modest monthly pullback following stable holiday-period spending.
-
Total retail and food services sales declined -0.2% MoM to $733.5B but increased +3.2% YoY, while sales for the November 2025 to January 2026 period were +2.9% higher than the same three-month period a year earlier.
-
Retail trade sales alone fell -0.2% MoM and increased +3.0% YoY, reflecting the broader softness across goods retailers during the month.
-
Sales excluding motor vehicles and parts were unchanged MoM and rose +3.9% YoY, while sales excluding gasoline stations increased +0.1% MoM and +3.7% YoY, showing steadier underlying retail spending once volatile categories are removed.
-
Motor vehicle and parts dealers saw sales fall -0.9% MoM and rise only +0.1% YoY, with auto and other motor vehicle dealers also declining -0.9% MoM and -0.2% YoY.
-
Gasoline station sales dropped -2.9% MoM and -3.7% YoY, marking the largest monthly decline among major categories and weighing on the headline retail figure.
-
Building materials and garden equipment dealers rose +0.6% MoM and +4.3% YoY, while food and beverage stores increased +0.2% MoM and +1.4% YoY, including grocery stores at +0.2% MoM and +1.5% YoY.
-
Several discretionary retail categories declined MoM, including clothing stores (-1.7% MoM; +3.0% YoY), electronics and appliance stores (-0.6% MoM; +2.0% YoY), and sporting goods, hobby, musical instrument, and book stores (-1.2% MoM; +3.2% YoY).
-
Nonstore retailers increased +1.9% MoM and +10.9% YoY, the strongest annual growth among major categories, while miscellaneous store retailers rose +2.0% MoM and +10.8% YoY.
-
Food services and drinking places declined -0.2% MoM but increased +3.9% YoY, indicating continued annual growth in spending at restaurants and bars despite the modest monthly dip.
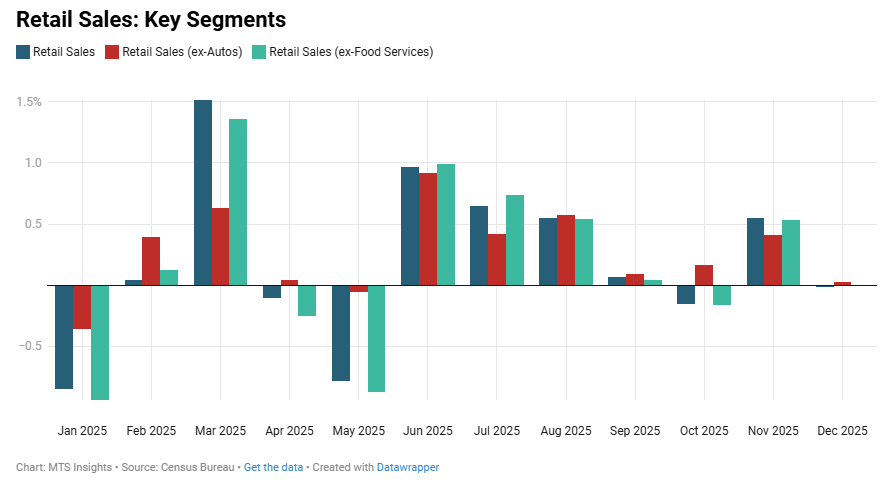
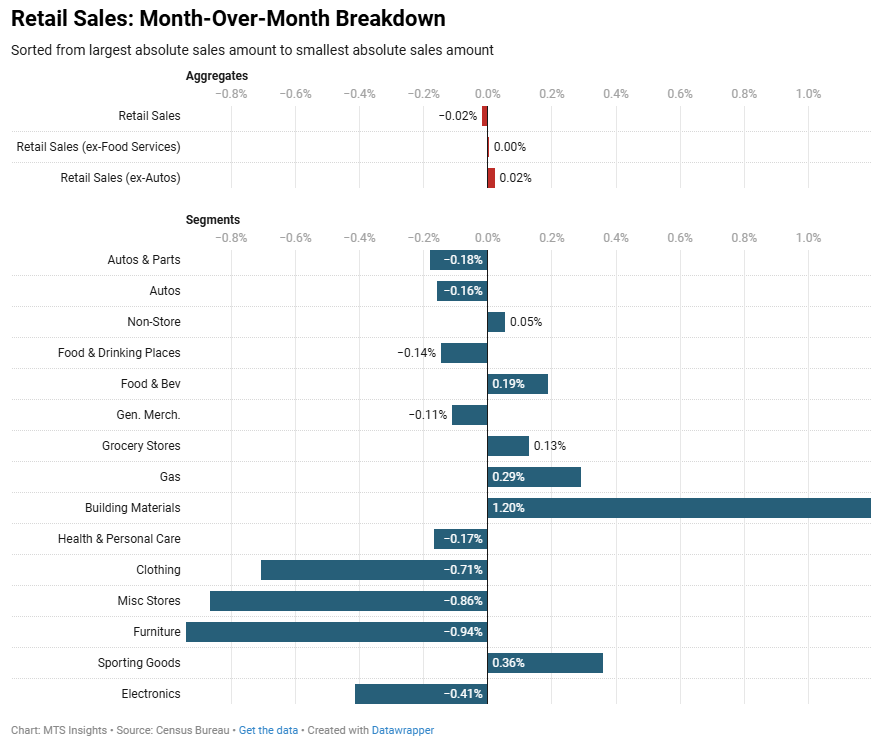
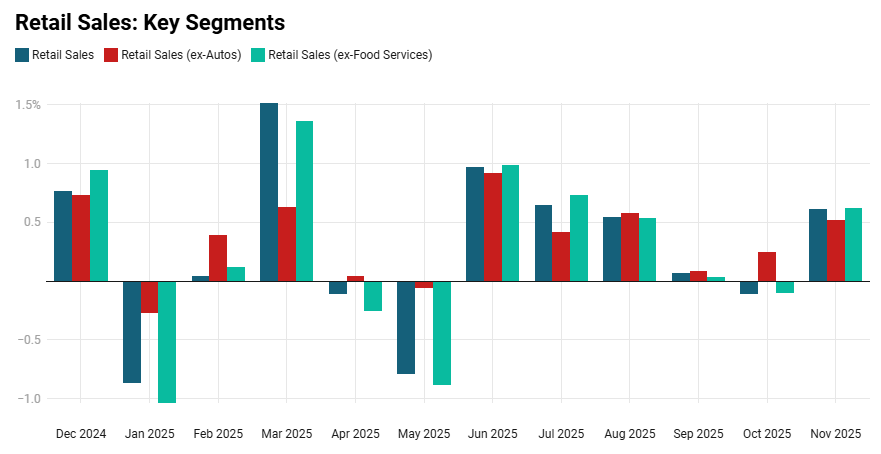
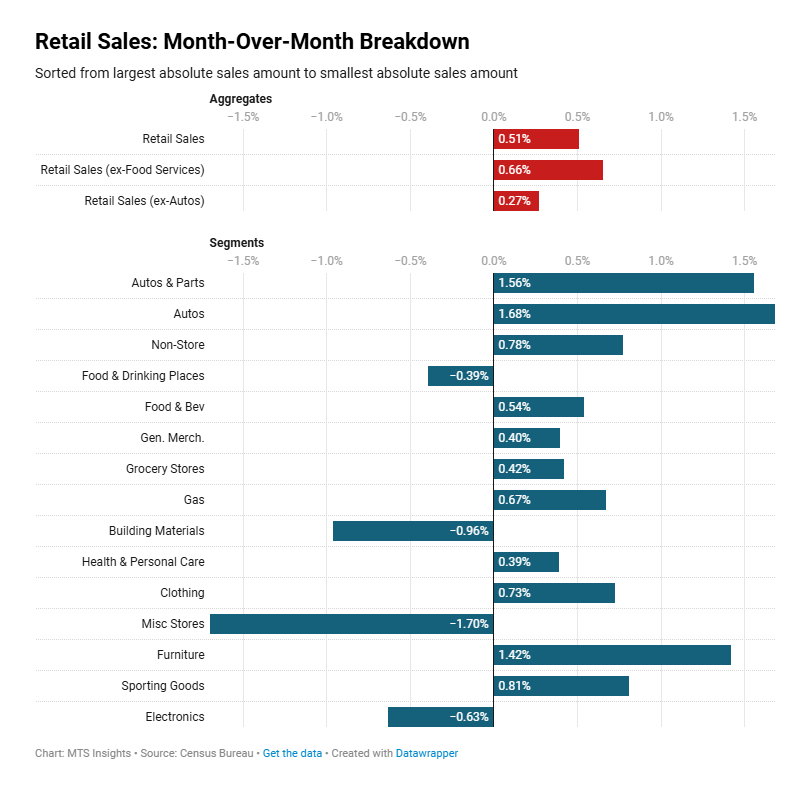
US retail sales were basically unchanged in December (vs 0.4% MoM expected), slowing from a 0.6% MoM increase in November (unrevised).
- Retail sales (ex autos) were unchanged month-over-month (vs 0.3% MoM expected), and sales (ex autos and gas) saw no growth as well.
- Most segments saw small gains or declines, including the largest segments: motor vehicle (-0.2% MoM) and nonstore retailers (+0.1% MoM).
- The largest gain came from the building materials segment, up 1.2% MoM for the second straight month.
- Many of the smaller segments saw significant declines: clothing (-0.7% MoM), miscellaneous stores (-0.9% MoM), furniture (-0.9% MoM), and electronics (-0.4% MoM).
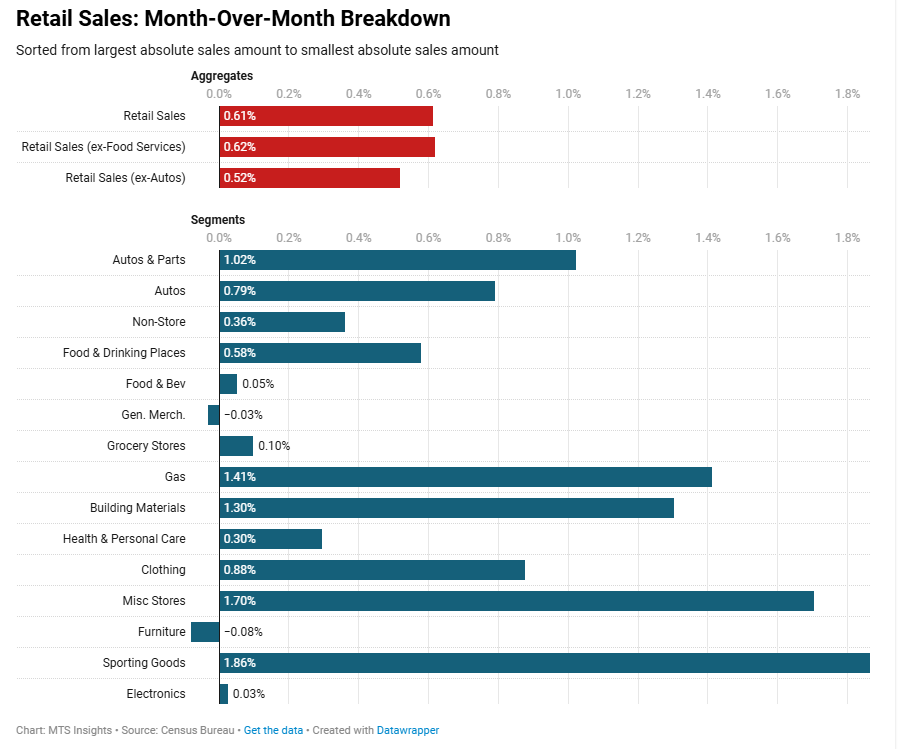
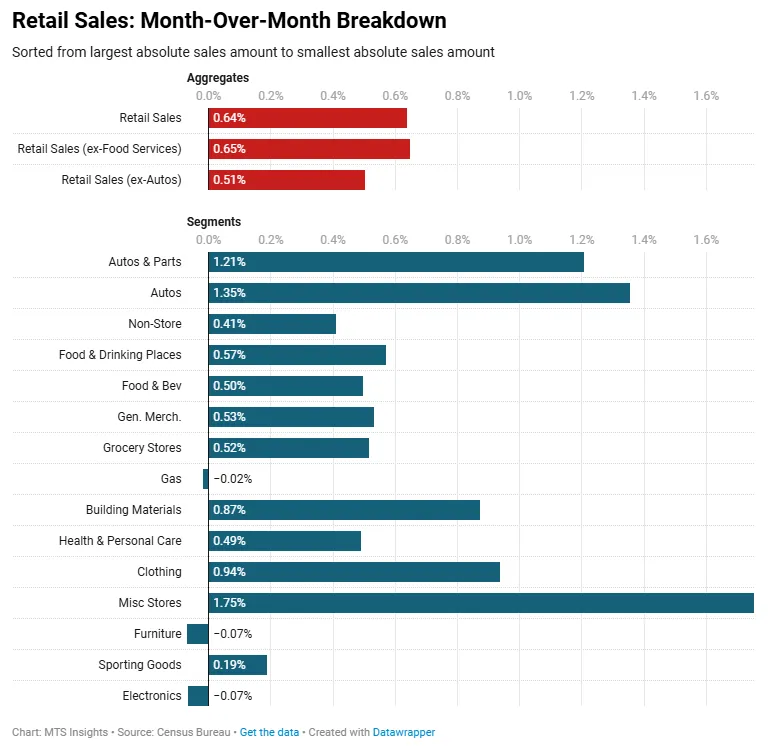
US retail sales increased 0.6% MoM (vs 0.4% MoM expected) in November after a -0.1% MoM decline in October (revised down from advance estimate of 0.0% MoM).
- Retail sales (ex autos) increased 0.5% MoM (vs 0.4% MoM expected), and sales (ex autos and gas) were up 0.6% MoM.
- Almost every segment saw gains in November, led by sporting goods & hobby stores (+1.9% MoM), gas stations (+1.4% MoM), and building materials & supplies stores (+1.3% MoM).
- Motor vehicle & parts sales were up 1.0% MoM but down -0.7% YoY.
- Solid growth from the larger non-store (0.4% MoM) and food services & drinking places (+0.6% MoM) segments helped boost the headline growth rate.
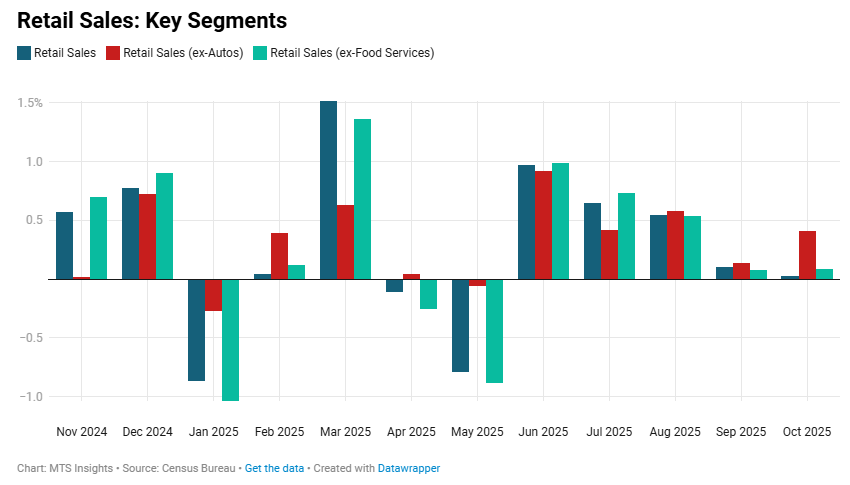
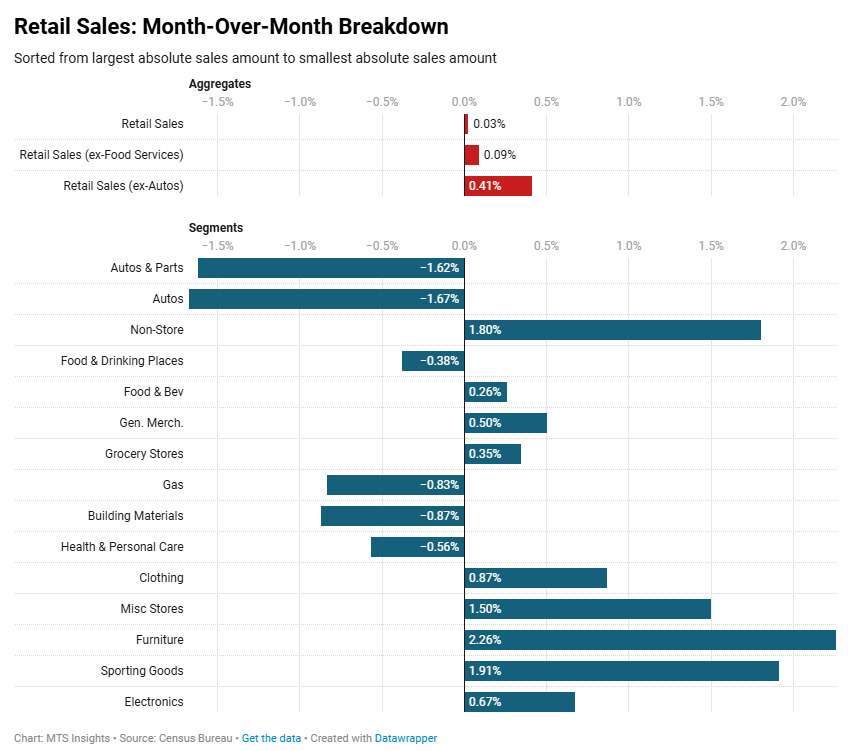
U.S. retail and food services sales were flat (vs +0.1% MoM expected) and up 3.5% YoY in October 2025, reflecting stalled headline growth as auto-related weakness offset gains elsewhere.
- Retail sales excluding motor vehicles and parts rose +0.4% MoM (vs +0.3% MoM expected) and up 4.0% YoY, indicating firmer underlying momentum once volatile auto sales are removed.
- Retail sales excluding gasoline increased +0.1% MoM (+3.6% YoY), showing modest growth despite softer fuel-related spending.
- Core retail sales excluding autos and gasoline advanced +0.5% MoM (+4.2% YoY), pointing to relatively steady demand across core goods categories.
- Motor vehicle and parts dealers declined -1.6% MoM (+1.2% YoY), with auto dealers down -1.7% MoM, driving most of the headline weakness.
- Furniture and home furnishings stores rose +2.3% MoM (+0.5% YoY), marking one of the stronger monthly gains among discretionary categories.
- Electronics and appliance stores increased +0.7% MoM (+4.9% YoY), continuing a solid year-over-year trend.
- General merchandise stores rose +0.5% MoM (+2.0% YoY), led by a +4.9% MoM jump at department stores, while nonstore retailers increased +1.8% MoM (+9.0% YoY), remaining the strongest YoY category.
- Food services and drinking places fell -0.4% MoM (+4.1% YoY), indicating a pullback after prior gains but still maintaining solid annual growth.
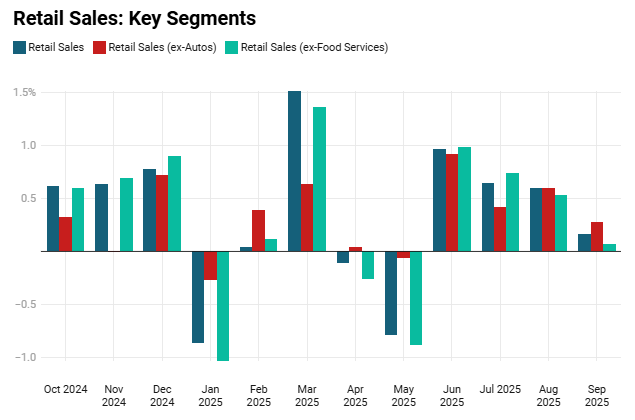
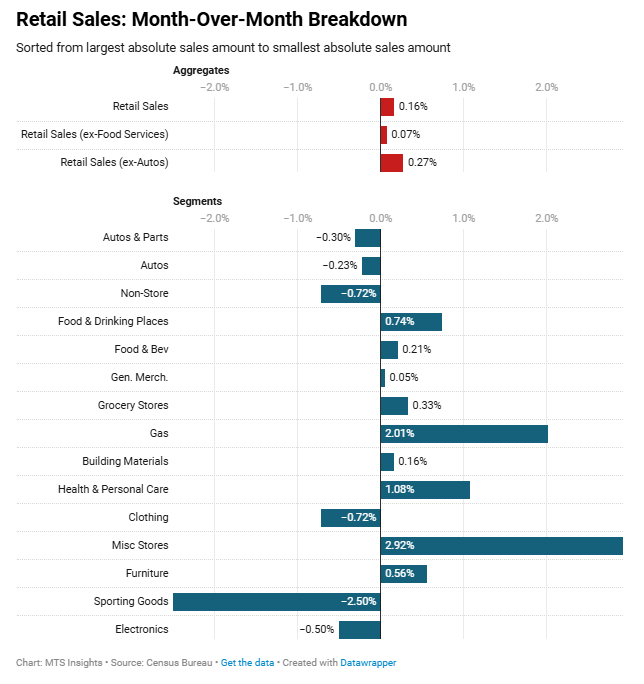
U.S. retail and food services sales rose 0.2% MoM (vs 0.4% MoM expected) in September 2025, reflecting a modest monthly gain, while the YoY comparison against September 2024 showed a 4.3% increase, indicating steady underlying demand despite mixed category performance.
-
Retail sales (ex autos) increased 0.3% MoM (vs 0.4% MoM expected), and sales (ex autos and gas) were up 0.1% MoM (vs 0.4% MoM expected).
-
Motor vehicle and parts dealers fell -0.3% MoM, with auto dealers down -0.2%, continuing the segment’s recent volatility.
-
Gasoline station sales rose 2.0% MoM, the strongest monthly increase among major categories, supported by higher fuel spending.
-
Furniture and home furnishings stores increased 0.6% MoM, reversing declines in prior months and contributing modestly to discretionary demand.
-
Electronics and appliance stores fell -0.5% MoM, consistent with ongoing weakness in big-ticket discretionary categories.
-
Sporting goods, hobby, musical instruments, and bookstores posted the sharpest decline at -2.5% MoM, underscoring soft discretionary spending.
-
Nonstore retailers (e-commerce) rose 2.9% MoM, marking one of the strongest gains in the report and continuing the segment’s solid multi-month trend.
-
Food services and drinking places increased 0.7% MoM, extending consistent growth and highlighting ongoing strength in services-oriented household spending.
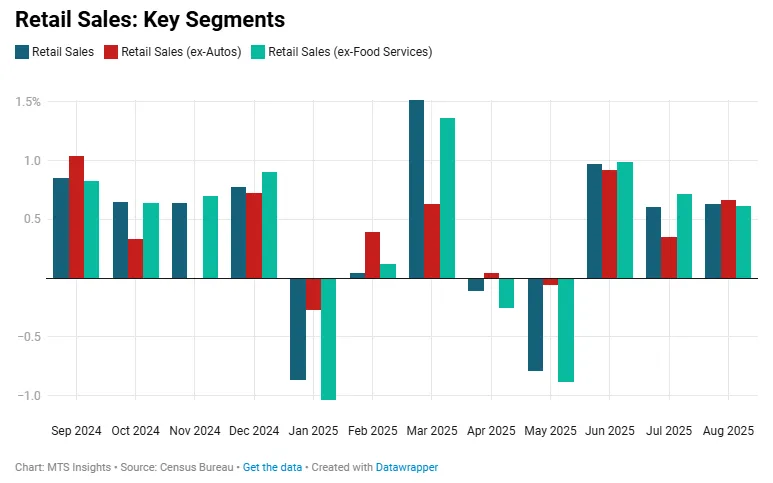
Consumers continued to show their resilience in August as retail sales came in above expectations in the second month of Q3 2025. The headline sales total increased by 0.6% MoM, ahead of the consensus forecast of just 0.2% MoM. Adding to the strength in the report was an upward revision in July's monthly growth from 0.5% MoM to 0.6% MoM. Overall, the summer months have brought about a strong trend in the retail sector with monthly growth averaging around 0.75% from June to August. Sales in those three months are up 1.0% over the March-May period and up 4.5% YoY.
The August retail sales number was heavily affected by the large auto segment as well. Retail sales of motor vehicles & parts were up 0.5% MoM, slightly behind the headline pace as the auto market cooled down from volatility seen earlier this year, caused by tariffs. Affordability is also a concern and has put a bit of a dampener on auto spending over the summer. The segment’s sales over the last three months were down by -0.4% MoM compared to the March-May period. However, on an annual basis, auto sales are up 5.6% YoY.
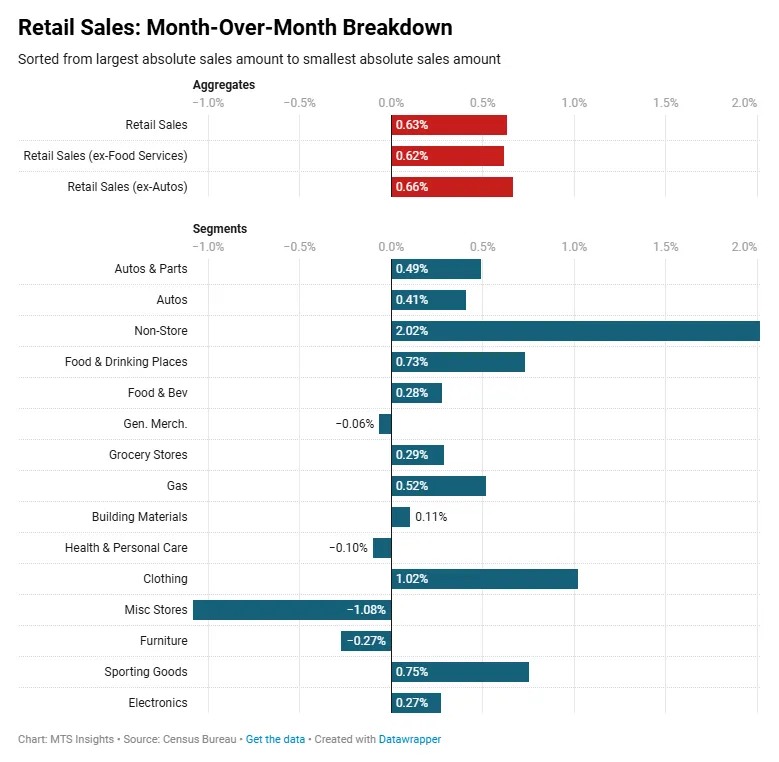
Outside of the auto segment, sales growth was even stronger than the headline rate, up 0.7% MoM, ahead of expectations of a 0.4% MoM increase. Here’s how the segments break down:
- The non-store segment of sales, the second largest segment, played a major role in driving sales growth in August. It saw a sharp 2.0% MoM increase, the largest one-month increase since September 2024. Removing this segment and the auto segment, sales growth was just 0.3% MoM in August and averaged 0.5% MoM in the summer months.
- Food & drinking place sales growth was 0.7% MoM in August and has been pretty strong over the summer. However, the solid growth in August looks tamer after a slight -0.1% MoM drop in July. Regardless, spending on this segment is up a healthy 6.5% YoY.
- Sales growth in various non-discretionary segments was a bit tamer. The food & beverage (+0.3% MoM), general merchandise (-0.1% MoM), and gas station (+0.5% MoM) segments all saw increases in August below the headline rate. When adjusted for inflation, these smaller gains suggest flat volume growth.
- Real estate-related segments looked to be some of the weakest segments in August. Furniture sales dropped -0.3% MoM during the month, though this did come after a 1.6% MoM increase in July. This segment may also have been affected by tariff-related volatility since furniture purchases tend to be infrequent and on the larger side. Building materials sales were up just 0.1% MoM in August and fell -0.9% during the summer months. Both tariffs and housing sector weakness are likely to continue to weigh on sales here in the near future.
US retail sales data in July pointed to a continuation of strength in consumer spending. Total retail sales increased 0.5% MoM in July, which was in line with what analysts expected, but the more surprising news was an upward revision in the June data that showed that monthly retail sales growth was a robust 0.9% MoM, up from the 0.6% MoM in the initial estimate. The strength fades a bit when excluding autos and gas. Retail sales excluding those categories were up just 0.2% MoM in July, a more substantial slowdown from the 0.8% MoM increase in June. Still, the near-term trend is robust. Sales ex gas and autos in the May to July period were 1.0% higher than in the February through April period. The bottom line is that even though retail sales growth has been volatile recently, the momentum appears to be holding up well as the nominal annual gain is still hovering around 4% YoY.
Here are some notes on key retail segments:
- Auto sales were the main force behind the headline gain as they increased 1.7% MoM in July, adding to the 1.6% MoM increase in June. However, these strong gains are a bit of a rally from the drop in sales that followed the tariff front-running in Q1. On an annual basis, auto sales are still growing at a healthy 4.7% YoY and not showing signs of capitulation.
- Non-store sales, the second largest retail category behind auto sales, were up 0.8% MoM and 8.0% YoY. The growth here was another reason for the strong headline number as e-commerce sales continue to drive consumer spending higher.
- Food & drinking services, down -0.4% MoM, were the primary dampener to spending growth. This affected the headline number, but is excluded from the retail trade total, which grew a robust 0.7% MoM. Even though there was a monthly decline, food & drinking services spending is still up 5.6% YoY.
- Broadly, most of the other categories saw sales higher in Jul,y with the largest gains in furniture (+1.4% MoM), sporting goods (+0.8% MoM), and clothing (+0.7% MoM). Interestingly, many of these segments would be sensitive to the rise in tariff rates on imported consumer goods, so it is safe to say that tariffs (and the modest increases in goods prices that have come so far) have not deterred consumers from buying goods.
- Building materials, down -1.0% MoM, and electronics & appliances, -0.6% MoM, look a bit like outliers. These categories might be a reflection of weakness in the real estate market, which is finding it difficult to cope with high interest rates.
US retail sales rose 0.6% MoM in June, well above the 0.1% MoM consensus forecast, partially reversing the -0.9% MoM drop in May. Sales were up 0.5% QoQ and 4.1% YoY in Q2 2025, with core retail sales (ex-auto and gas) also increasing 0.6% MoM and accelerating to a 1.1% QoQ gain.
- Motor vehicle and parts sales rebounded 1.2% MoM after a -3.8% MoM drop in May, and were up 6.5% YoY in June.
- Gasoline sales were flat MoM, but down -3.3% QoQ and -5.6% YoY in Q2, reflecting weak oil prices.
- Nonstore sales rose 0.4% MoM and 1.5% QoQ, the strongest quarterly gain among goods segments.
- Food services & drinking places were up 0.6% MoM and 2.5% QoQ, the highest among all categories.
- Discretionary goods like electronics (-0.1% MoM), furniture (-0.1% MoM), and sporting goods (+0.2% MoM) were soft but had minimal impact on the headline due to their small weight.