


US International Trade: November 2025 (DELAYED)
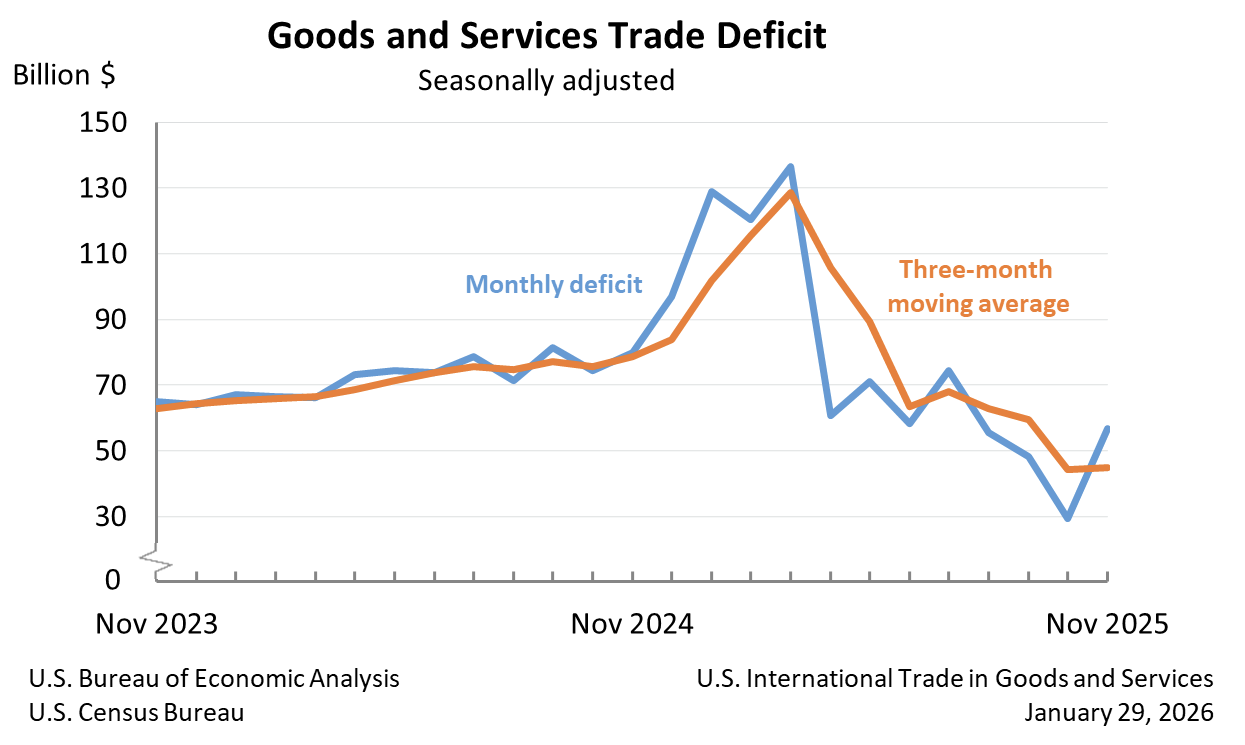
The U.S. goods and services trade deficit widened to $56.8B in November 2025 (+94.6% MoM; largest MoM move on record), reversing October’s sharp narrowing amid falling exports and rising imports.
-
Exports declined to $292.1B (-$10.9B MoM; -3.6% MoM), driven by an -$11.1B drop in goods exports led by industrial supplies (-$6.1B), nonmonetary gold (-$4.2B), and consumer goods (-$3.1B), while services exports edged up +$0.2B.
-
Imports increased to $348.9B (+$16.8B MoM; +5.0% MoM), with goods imports up +$16.8B led by consumer goods (+$9.2B), capital goods (+$7.4B), pharmaceuticals (+$6.7B), and computers (+$6.6B), while services imports dipped -$0.1B.
-
The goods deficit widened +$27.9B MoM to $86.9B, while the services surplus rose slightly +$0.3B to $30.1B, showing the deterioration was concentrated in merchandise trade.
-
Year-to-date, the total trade deficit rose +$32.9B (+4.1% YoY), as exports increased +6.3% YoY and imports increased +5.8% YoY, indicating faster import growth over 2025 overall.
-
The three-month average deficit edged up to $44.7B (+$0.4B), though it was -$33.8B lower YoY, with average exports up +$23.4B YoY and average imports down -$10.4B YoY.
-
On a real basis, the goods deficit expanded +$23.5B MoM (+36.9%) to $87.1B, as real exports fell -6.0% MoM and real imports rose +6.3% MoM, confirming a large volume-driven widening.
-
Bilaterally, deficits widened with the EU (+$8.2B to $14.5B) and Singapore (from +$1.8B to -$1.1B), while the surplus with Switzerland rose to $7.8B (+$0.6B), highlighting uneven partner-level shifts.