

US PPI: November 2025 (DELAYED)
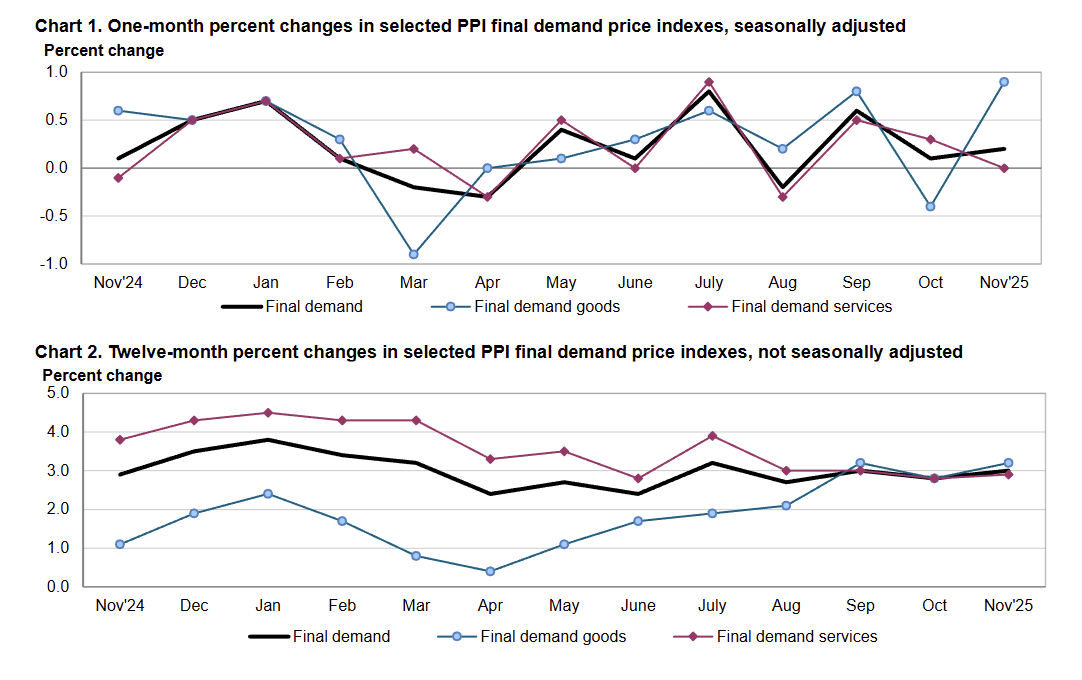
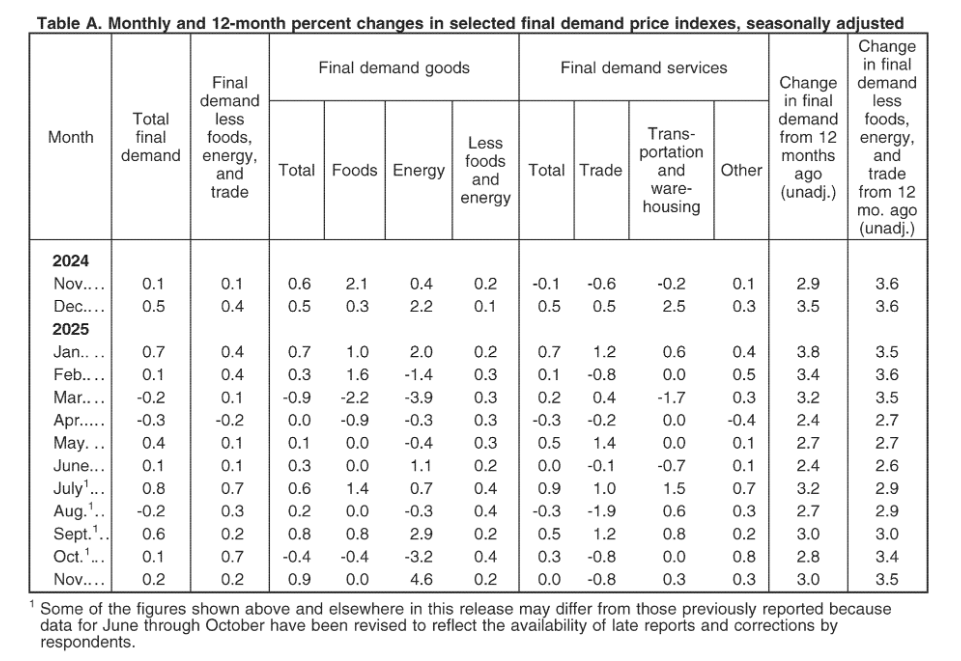
US final demand PPI increased 0.2% MoM (vs 0.2% MoM expected) and 3.0% YoY (vs 2.7% YoY expected) in November, up from 2.8% YoY in October.
- Core PPI was flat (vs +0.2% MoM expected) and up 3.0% YoY (vs 2.7% YoY expected), up from 2.8% YoY previously.
- Goods PPI jumped 0.9% MoM in November on a strong 4.6% MoM increase in energy PPI while core goods PPI was up just 0.2% MoM.
- Services PPI was flat on a monthly basis as trade PPI (tracking wholesale and retail margins) fell 0.8% MoM in both October and November.
- In terms of intermediate demand, processed goods PPI increased 0.6% MoM and 3.6% YoY, almost entirely due to energy.
- Excluding food and energy, the segment was only up 0.1% MoM. Unprocessed goods PPI was up 0.4% MoM as raw input energy and nonfood, nonenergy goods increased while raw food input PPI fell -0.9% MoM.
- Services for intermediate demand PPI increased 0.2% MoM in November, led by a 0.5% MoM increase in the transportation & warehousing segment.
- With rates falling, PPI for business loans saw a large decline of -4.5% MoM.
- BLS also highlighted that “Over half of the increase in the index for services for intermediate demand can be attributed to a 4.2% MoM jump in prices for management consulting services.”