

S&P Case Shiller Home Price Index: October 2025
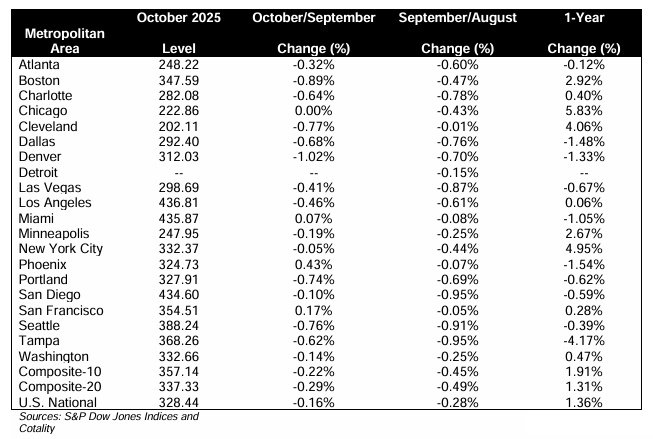
U.S. home prices rose +1.4% YoY in October 2025 and were flat to slightly negative MoM, reflecting stalled momentum amid broad regional divergence.
-
The S&P Dow Jones Indices Case-Shiller U.S. National Home Price Index posted a +1.4% YoY gain in October, up from +1.3% YoY in September, marking one of the weakest annual increases since mid-2023.
-
The 10-City Composite rose +1.9% YoY (down from +2.0%), and the 20-City Composite increased +1.3% YoY (down from +1.4%), underscoring continued deceleration outside the national aggregate.
-
On a MoM basis (NSA), the National Index fell -0.2%, while the 10-City and 20-City Composites declined -0.2% and -0.3%, respectively, indicating widespread monthly softness before seasonal adjustment.
-
After seasonal adjustment, the National Index rose +0.4% MoM, and both the 10-City and 20-City Composites increased +0.3% MoM, showing only modest support once seasonality is accounted for.
-
Sixteen of 20 metro areas recorded MoM declines in October (NSA), with Cleveland, Boston, Seattle, and Denver each falling roughly -0.8% to -1.0%, pointing to broad short-term stagnation.
-
Regional divergence persisted on an annual basis, led by Chicago (+5.8% YoY), New York (+5.0% YoY), and Cleveland (+4.1% YoY), while Sun Belt markets lagged, including Tampa (-4.2% YoY), Phoenix (-1.5% YoY), Dallas (-1.5% YoY), and Miami (-1.1% YoY).
-
Data for Detroit were unavailable for October due to transaction reporting delays, though September data were sufficient for prior updates, limiting full metro coverage for the latest release.