

S&P Case Shiller Home Price Index: September 2025
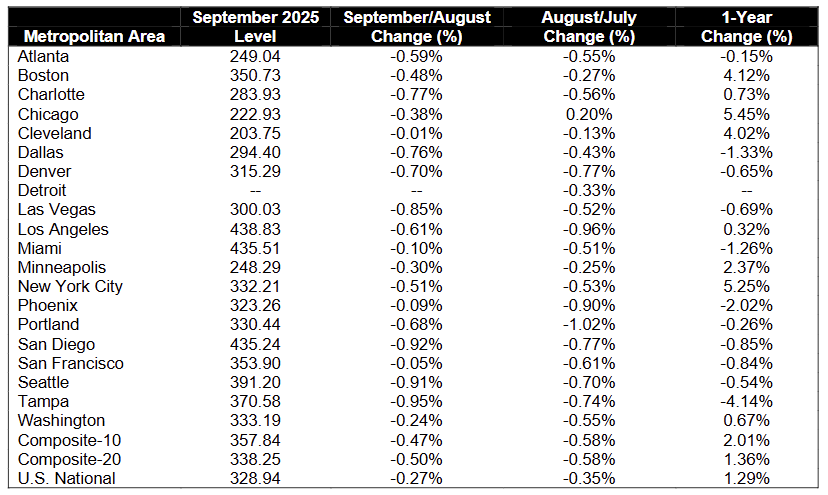
U.S. home prices rose 1.3% YoY in September 2025 (from 1.4% YoY in August), reflecting continued deceleration and marking the weakest annual gain since mid-2023 amid broad affordability pressures.
-
The National Index fell -0.3% MoM (NSA), while the 10-City and 20-City Composites declined -0.5% MoM, showing broad monthly weakening before seasonal adjustment.
-
After seasonal adjustment, the National and 10-City composites rose +0.2% MoM, and the 20-City Composite increased +0.1%, indicating only marginal support once seasonality is accounted for.
-
Inflation continued to outpace home prices for a fourth straight month, with September CPI running 1.7 ppts above home-price appreciation, the widest gap since the divergence began in June.
-
Regional divergence widened: Chicago (+5.5% YoY), New York (+5.2% YoY), and Boston (+4.1% YoY) led gains, while Tampa (-4.1% YoY), Phoenix (-2.0% YoY), Dallas (-1.3% YoY), and Miami (-1.3% YoY) posted declines.
-
All 20 metros saw MoM declines before adjustment, with the steepest drops in Tampa (-1.0% MoM), San Diego (-0.9% MoM), and Seattle (-0.9% MoM), signaling broad cooling as mortgage rates near 6.3% weigh on demand.
-
Over the past six months, national prices have risen only 0.4%, a gain that is effectively negative after adjusting for inflation, highlighting fading momentum since early-2025.
-
Only 7 of 20 metros posted positive six-month gains, while most Sun Belt and Western markets saw outright declines, underscoring the shift back toward pre-pandemic regional patterns.