


US CPI: November 2025 (DELAYED)
After months of concern that inflation pressures were proving stubborn, this CPI release forces a rethink of the near term narrative. The report points to a broad cooling in underlying price momentum, with the most persistent categories finally showing signs of relief, even as volatility in headline components complicates the signal. At the same time, unusual data gaps introduce a layer of uncertainty that makes it difficult to separate genuine disinflation from statistical distortion. The result is a report that looks decisively softer on the surface, but one that both markets and policymakers are likely to treat with caution until a more complete picture emerges.
CPI
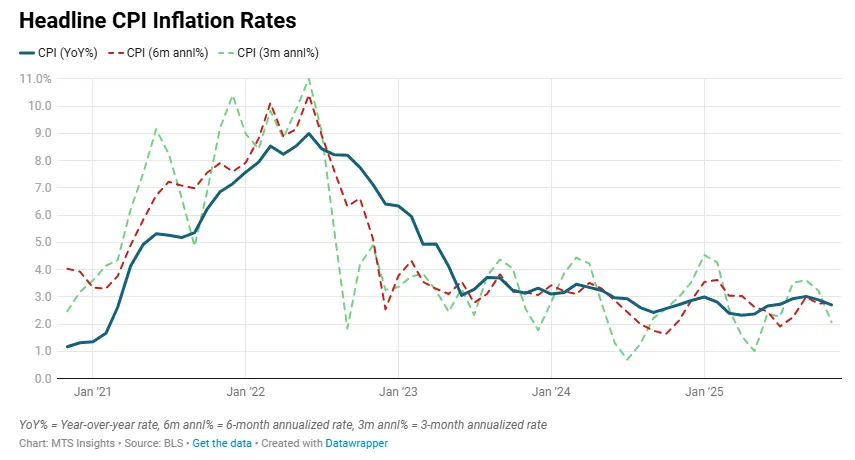
According to an odd-looking CPI report with spotty data, the November annual inflation rate was 2.7% YoY, down from the September annual rate of 3.0% YoY and well below expectations of a slight uptick to 3.1% YoY. This brings the CPI inflation rate in line with where it was earlier this July and reverses the reinflation trend that we have seen since April. More importantly, today’s inflation report shows core CPI inflation at 2.6% YoY, the lowest it has been since March 2021.
Unfortunately, with no MoM data for October and November, we must rely on the changes in the annual inflation rates to analyze the details of the report. Let’s first look at the volatile components and see how they affected the movement in the headline rate.
- Food inflation was measured at 2.6% YoY in November, significantly slower than the 3.1% YoY increase in September. It appears that almost all of the disinflation came from the food at home index, which slowed from 2.7% YoY to 1.9% YoY. Five of the six grocery subcategories saw lower YoY inflation, including the dairy products segment, which moved to -1.6% YoY, the weakest since March 2024.
- Offsetting some of the weakness in the food segment was energy, where the annual inflation rate accelerated from 2.8% YoY in September to 4.2% YoY in November, the highest since February 2023. We do happen to have monthly rates for the largest energy subindex, gasoline, and that data shows some volatility across October and November, falling -2.1% MoM in the former month and rising 3.0% MoM in the latter. The strongest driver of energy inflation over the last two months looks to be electricity, which accelerated from 5.1% YoY in September to 6.9% YoY in November (highest since April 2023), pushing energy services inflation up to 7.4% YoY.
It is hard to tell exactly what happened over the last two months, given the lack of data, but it seems that within the volatile components, there was a strong disinflationary impulse in the food segment. The 2-month change from September to November for this component was just 0.06% or about 0.03% MoM over the last two months. This would be the weakest monthly rates since food prices dropped in April.
Core CPI
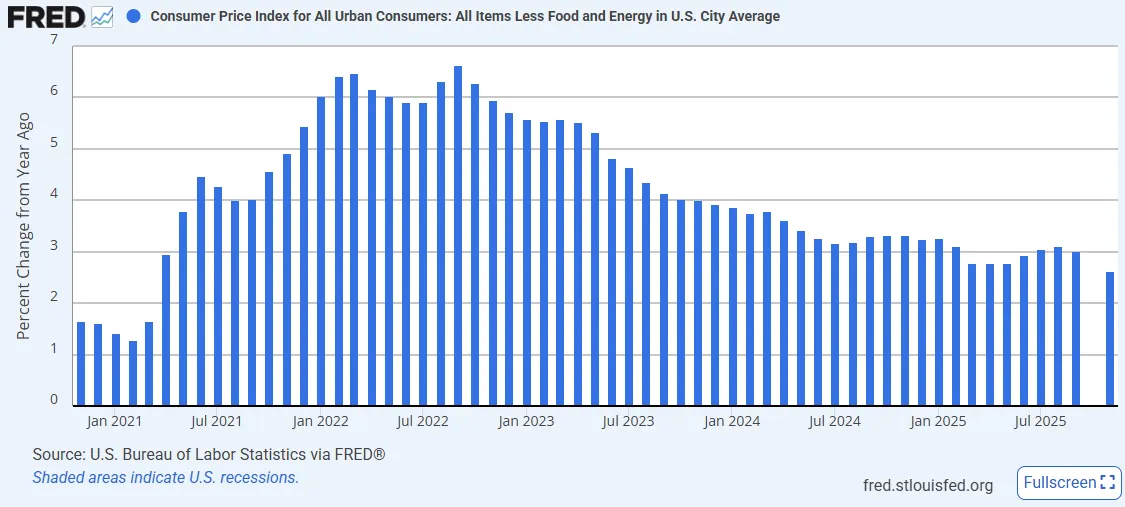
The focus of the November CPI report will be on the strong disinflationary trend in the core CPI rate, which dropped to 2.6% YoY, down from 3.0% YoY in September and the lowest it has been since March 2021. The implied 2-month change in the core CPI index comes out to 0.16% or roughly 0.08% MoM over the last two months. This would be the lowest monthly pace since March, and the lowest 2-month rate since around 2017. Additionally, this would be a sudden and significant slowdown from the average monthly pace in Q3 2025 of 0.30% MoM. Let’s look at what data we do have on the core subindexes.
- Other than gasoline, we do have a monthly value for new and used car prices in October, so monthly rates for October and November were provided. New vehicle prices increased just 0.1% MoM in October and 0.2% MoM in November, while used vehicle prices were slightly hotter at 0.7% MoM and 0.3% MoM, respectively. Notably, both saw lower annual rates and contributed to a slight disinflationary trend in core goods inflation.
- Core goods inflation eased slightly from 1.5% YoY in September to 1.4% YoY in November. As just mentioned, auto price movement was muted, which restricted the volatility in the core goods segment. The changes in the annual rates in the other core goods subsegments were mixed: household furnishings eased from 3.0% YoY to 2.6% YoY, apparel edged up from -0.1% YoY to 0.2% YoY, and medical care goods increased from 0.7% YoY to 1.1% YoY (which happens to be the largest since February).
- Core services inflation saw a more significant deceleration from 3.5% YoY in September to 3.0% YoY in November, the lowest annual rate since September 2021. This was almost entirely driven by shelter inflation slowing from 3.6% YoY to 3.0% YoY, the lowest since August 2021. The cooling of price pressures did extend to the smaller services segments as every core services subsegment saw disinflation over the last two months, except for education & communication services. This is demonstrated by the fact that core services (ex rent of shelter) inflation eased from 3.7% YoY in September to 3.5% YoY in November.
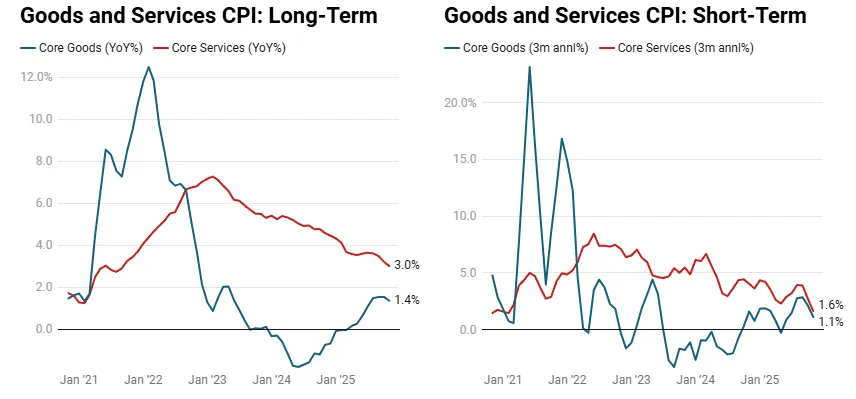
Indeed, the above charts demonstrate just how sharp a shift there was in the momentum of core services inflation. The short-term measure, which looks at the annualized 3Mo3M rate, dropped to 1.6% in November, the lowest since February 2021. When this is combined with core goods price pressures falling away and a downside surprise in food inflation, we end up with much lower than expected headline and core CPI inflation rates. However, this report comes with a major caveat since the BLS admits that the government shutdown caused significant disruptions to data collection, and therefore, calls into question some of the trends.
For example, it appears that the BLS “just assumed that rent/owner’s equivalent rent (OER) was zero for October,” according to a post by Nick Timiraos. This would’ve put major downward pressure on the headline and core annual rates since shelter is such a large component of the calculation. I also find the sudden shift in food inflation to be jarring, from averaging around 0.37% MoM in Q3 2025 to a 2-month average of around 0.03% in October and November. If we remove shelter and food from CPI (which, admittedly, is removing around 50% of the components), the annual rate only fell from 2.6% YoY in September to 2.5% YoY in November.