US Trade Price Indexes: January 2026 (DELAYED)
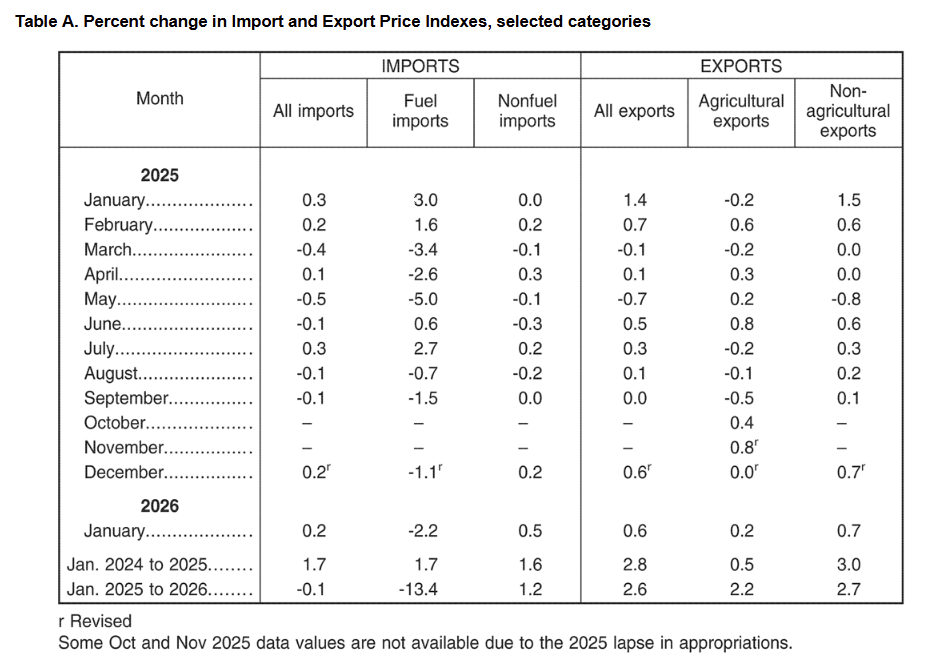
U.S. import prices increased +0.2% MoM and declined -0.1% YoY in January 2026, while export prices rose +0.6% MoM and +2.6% YoY, reflecting higher nonfuel import prices and broad gains across export categories.
-
Import prices increased +0.2% MoM in January after rising +0.2% in December, but were -0.1% YoY lower than January 2025, indicating modest monthly price pressure alongside a slight annual decline.
-
Fuel import prices fell -2.2% MoM following a -1.1% decline in December and were down -13.4% YoY, as petroleum prices declined -2.7% MoM (-15.9% YoY) while natural gas prices increased +3.3% MoM and surged +36.4% YoY.
-
Nonfuel import prices rose +0.5% MoM following a +0.2% increase in December and were up +1.2% YoY, with increases across industrial supplies, capital goods, automotive vehicles, consumer goods, and food products driving the gain.
-
Import prices for nonfuel industrial supplies and materials increased +0.9% MoM after a +1.6% increase in December, reflecting higher prices for finished metal shapes, nonmetals, and chemicals.
-
Finished goods import prices also rose in January, with capital goods up +0.4% MoM, automotive vehicles up +0.2% MoM, and consumer goods up +0.1% MoM, showing broad-based increases across major import categories.
-
Export prices increased +0.6% MoM for a second consecutive month and rose +2.6% YoY, supported by higher prices for both agricultural and nonagricultural exports.
-
Agricultural export prices increased +0.2% MoM and +2.2% YoY, with higher prices for other food preparations and corn offsetting declines in fruit and meat prices, while nonagricultural export prices rose +0.7% MoM and +2.7% YoY.
-
Prices for export capital goods rose +0.9% MoM, export consumer goods increased +1.0% MoM, and export automotive vehicles prices ticked up +0.1% MoM, reflecting gains across finished export categories.