

US PPI: January 2026 (DELAYED)
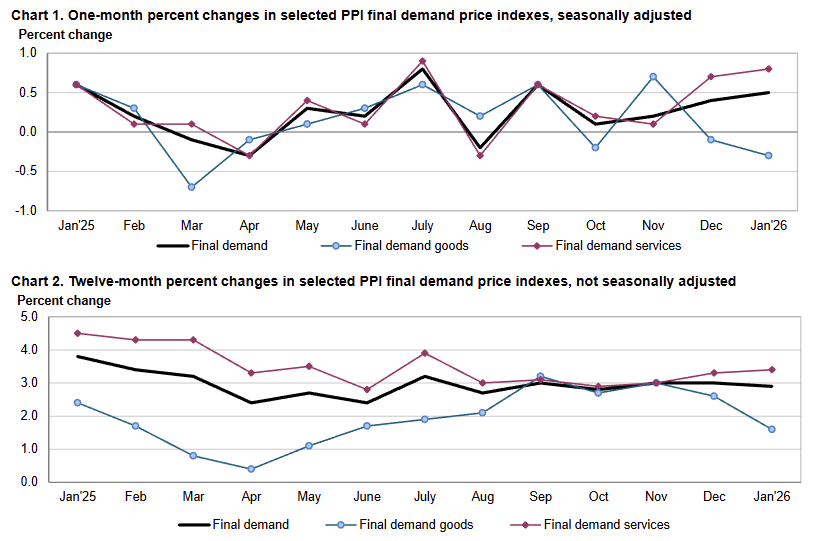
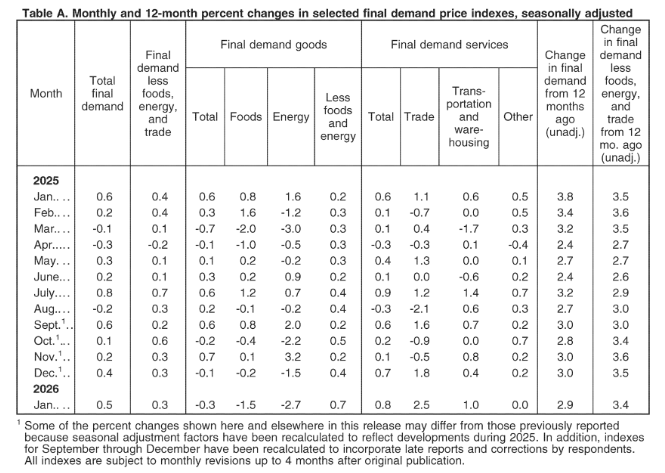
US final demand PPI rose +0.5% MoM (vs +0.3% MoM expected) and +2.9% YoY (vs +2.6% YoY expected) in January 2026, led by services price pressures.
-
Final demand services increased +0.8% MoM while goods fell -0.3% MoM, showing services were the primary driver of the monthly rise.
-
Core PPI excluding food, energy, and trade services rose +0.3% MoM and +3.4% YoY, marking the ninth consecutive monthly increase.
-
Processed goods for intermediate demand were unchanged MoM and up +2.6% YoY, as a +0.5% rise in core materials offset declines in energy (-2.0%) and foods (-0.6%).
-
Unprocessed goods for intermediate demand fell -0.5% MoM and -6.1% YoY, driven largely by a -3.5% drop in foodstuffs including raw milk (-9.8%).
-
Services for intermediate demand increased +0.3% MoM and +2.9% YoY, the fifth straight monthly rise led by trade margins (+1.6%).
-
Transportation and warehousing services rose +0.5% MoM while margins for chemicals wholesaling jumped +8.4%, contributing significantly to service inflation.
-
Business loan prices fell -7.5% MoM and freight arrangement services declined, offsetting some of the broader services increases.