


FHFA House Price Index: December 2025
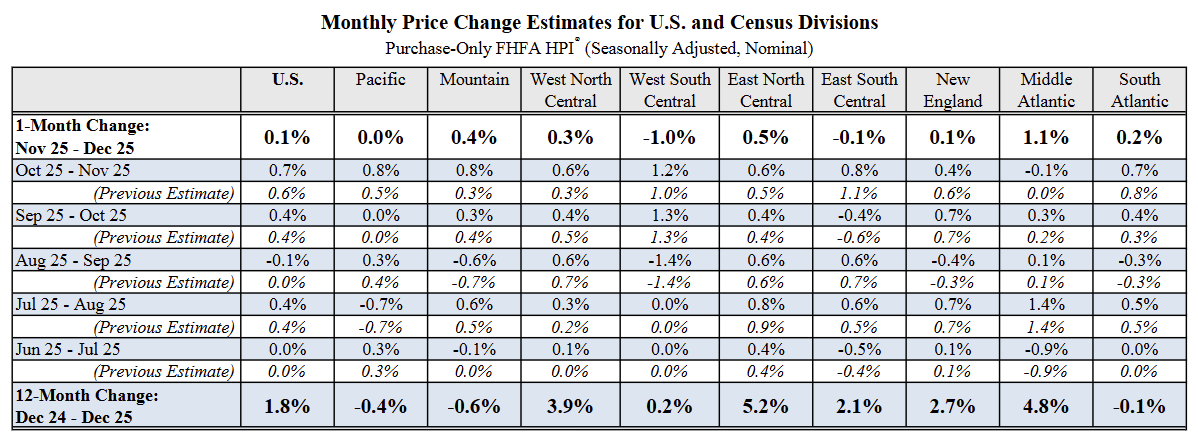
U.S. house prices rose +0.1% MoM (vs +0.3% MoM expected) and +1.8% YoY in December 2025, extending a long run of positive appreciation.
-
The FHFA purchase only HPI increased +0.1% MoM in Dec (from +0.7% MoM in Nov), showing a slower monthly pace after a stronger prior gain.
-
Quarterly prices rose +0.8% QoQ in Q4 2025 and +1.8% YoY vs Q4 2024, maintaining annual growth that has persisted each quarter since 2012.
-
Price gains occurred in 41 states YoY, led by North Dakota +6.4%, Delaware +6.3%, Illinois +6.1%, Wisconsin +5.7%, and Michigan +5.5%, while nine states and DC declined, with Florida -2.7% the largest drop.
-
Across metros, 66 of the 100 largest areas posted increases YoY; Allentown Bethlehem Easton +8.9% had the biggest rise while Cape Coral Fort Myers -9.1% had the largest decline, showing wide geographic dispersion.
-
Regionally, the East North Central division recorded the strongest YoY gain at +5.0%, whereas the Mountain division declined -0.2% YoY, indicating uneven regional performance.
-
From Nov to Dec, divisions ranged from -1.0% MoM in West South Central to +1.1% MoM in Middle Atlantic, highlighting mixed short-term momentum across regions.
-
Over the past year, division-level changes ranged from -0.6% YoY in Mountain and -0.4% YoY in Pacific to +5.2% YoY in East North Central and +4.8% YoY in Middle Atlantic, reinforcing variation in annual appreciation trends.