
US Pending Home Sales: December 2025
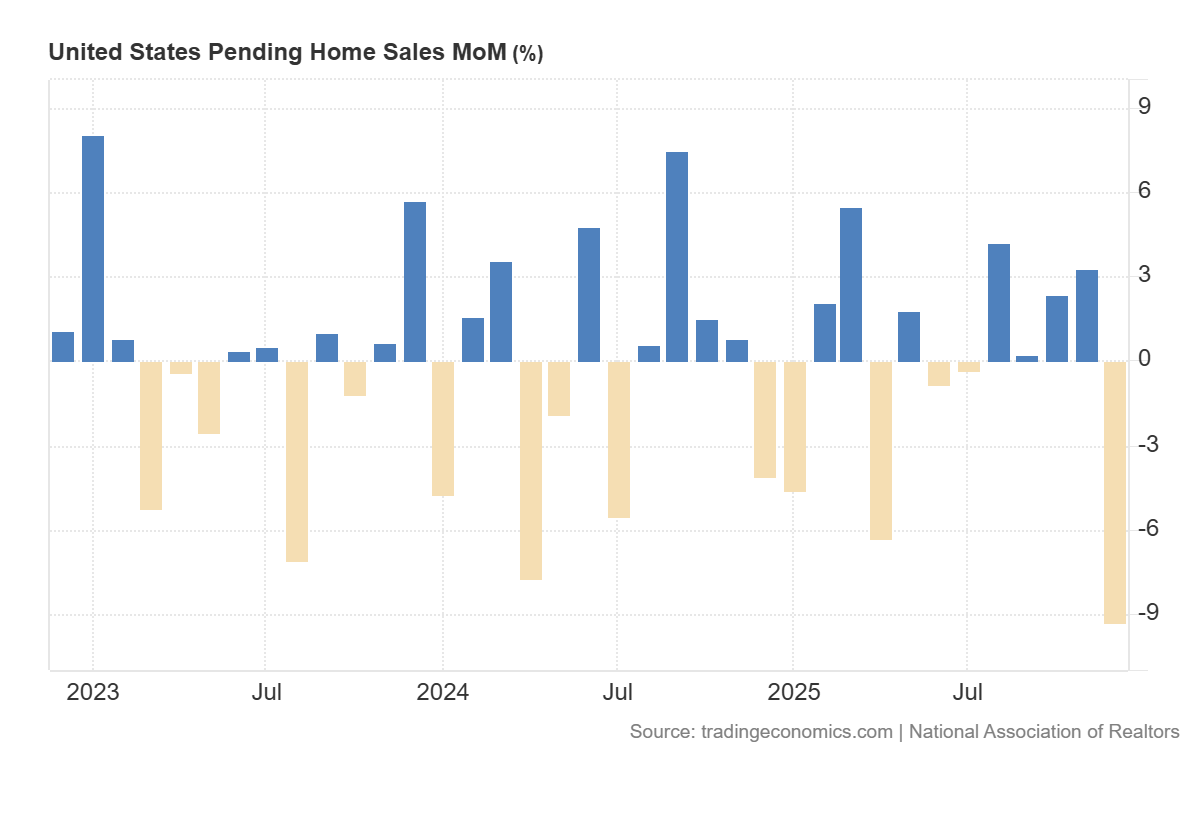
U.S. pending home sales fell -9.3% MoM and -3.0% YoY in December 2025, reversing recent improvement in contract signings.
-
The National Pending Home Sales Index declined -9.3% MoM, the largest one-month drop since April 2020, indicating a broad-based pullback in new contracts.
-
On a YoY basis, pending sales were down -3.0%, as gains in the South were more than offset by declines in the Northeast, Midwest, and West.
-
Regional detail: Northeast -11.0% MoM and -3.6% YoY, showing both a sharp monthly drop and a continued annual decline.
-
Midwest -14.9% MoM and -9.8% YoY, the largest declines across regions on both a monthly and annual basis.
-
South -4.0% MoM but +2.0% YoY, standing out as the only region with positive annual growth despite a monthly contraction.
-
West -13.3% MoM and -5.1% YoY, reflecting a sizable monthly pullback alongside a weaker annual trend.
-
Inventory was cited at 1.18M homes in December, matching the lowest level of 2025, suggesting limited listings alongside softer contract activity.
-
Realtor confidence metrics for December closings showed median time on market at 39 days (vs 36 prior month; 35 a year earlier), first-time buyers at 29% (vs 30%; 31%), and investor/second-home share at 18% (flat MoM; up from 16% YoY).