

Redfin Home Price Index: November 2025
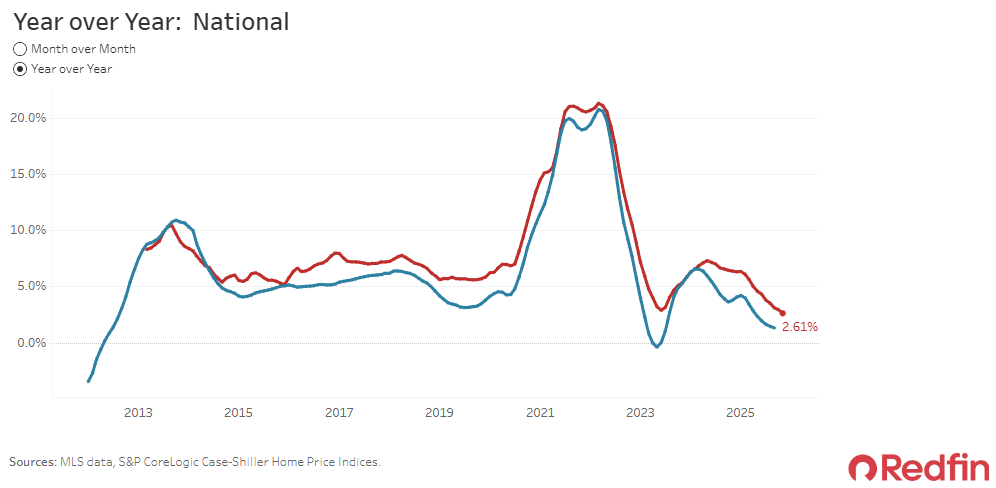
U.S. home prices rose +0.2% MoM in November and +2.6% YoY, marking continued cooling in annual price growth.
-
The +0.2% MoM increase in November was slightly slower than October’s +0.3% gain, indicating modest deceleration in monthly momentum.
-
YoY price growth eased to +2.6% (Oct: +2.9%), the slowest annual increase in data going back to 2012, extending the downtrend seen since early 2025.
-
Home prices declined MoM in 11 major metro areas, fewer than earlier in the year, suggesting more limited geographic weakness.
-
The largest MoM declines occurred in Charlotte (-0.9%), Austin (-0.6%), and Cincinnati (-0.6%), highlighting continued softness in select Sun Belt and Midwest markets.
-
The strongest MoM gains were in Pittsburgh (+2.3%), Montgomery County, PA (+1.6%), and Chicago (+1.3%), pointing to uneven regional price dynamics.
-
On a YoY basis, Chicago (+11.0%), Pittsburgh (+10.1%), and New York (+9.5%) posted the largest increases, while Austin (-3.8%), Dallas (-2.8%), and Oakland recorded annual declines.