


US Personal Income and Outlays: September 2025 (DELAYED)
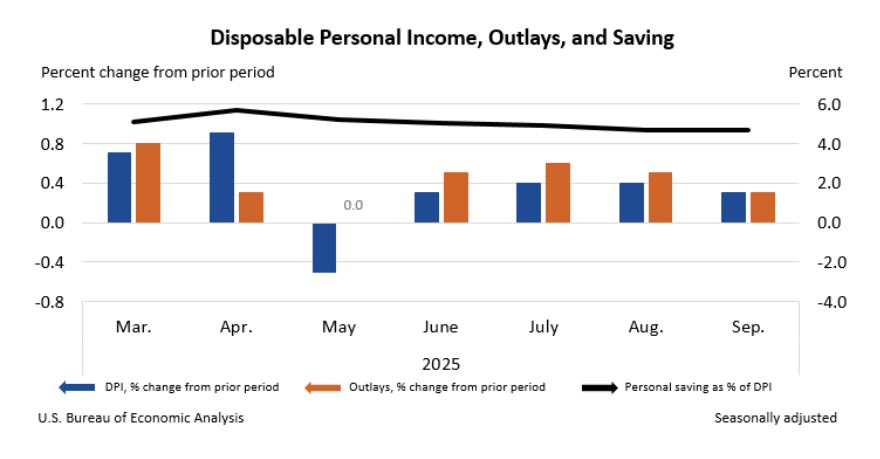
Personal income rose +0.4% MoM (vs +0.3% MoM expected) in September, while disposable income increased +0.3% MoM and PCE grew +0.3% MoM (vs +0.3% MoM expected), reflecting steady nominal income gains alongside moderate spending momentum.
-
Current dollar income increased by $94.5 billion, driven primarily by compensation and asset income, with private wages up $41.2 billion and dividend income rising $19.8 billion.
-
Disposable personal income increased $75.9 billion (+0.3% MoM), while real disposable income grew +0.1% MoM, indicating softer inflation adjusted income growth.
-
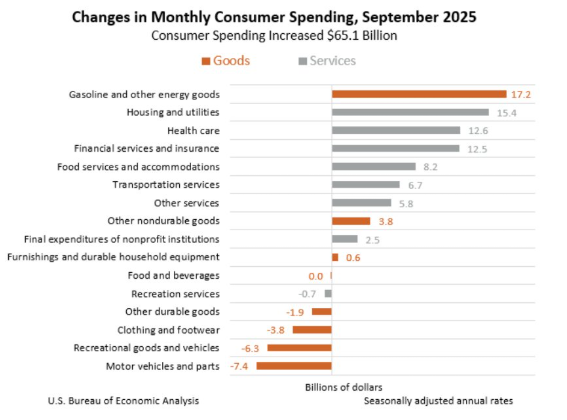
Personal consumption expenditures rose $65.1 billion (+0.3% MoM), with services accounting for nearly all of the gain (+$63.0 billion) and goods contributing a modest +$2.1 billion.
-
Real PCE was flat (0.0% MoM), suggesting that the increase in nominal spending was fully offset by price growth.
-
Half of the growth in consumer spending in September is attributed to gas & other energy goods (+$17.2 bil) and housing & utilities (+$15.4 bil).
-
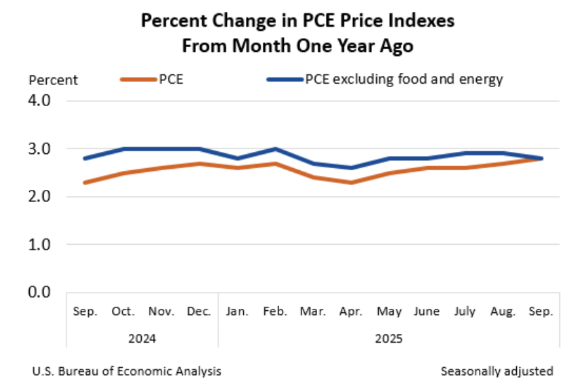
PCE prices increased 0.3% MoM (vs 0.3% MoM expected) and 2.8% YoY in September, up from 2.7% YoY in August. Core PCE prices edged up 0.2% MoM (vs 0.2% MoM expected), and the annual rate eased -0.1 ppt to 2.8% YoY (vs 2.9% YoY expected).
-
The personal saving rate held at 4.7%, with total saving at $1.09 trillion, showing limited change in household financial cushions.
-
Compensation growth broadened across categories: services wages rose $32.3 billion, goods producing wages rose $8.9 billion, and government wages increased $7.1 billion, while supplements added another $10.7 billion.
-
Spending gains were widely distributed across both goods and services categories, with notable increases in food services and accommodations, health care, and recreation services, consistent with broad based consumer activity.