


US CPI: September 2025
September’s inflation report delivered a familiar but mildly encouraging picture. Headline gains were lifted by volatile components, while underlying price pressures continued to ease. Core categories cooled further, hinting that tariff-related inflation may be proving short-lived, and services inflation, especially housing, continued its gradual slowdown. Overall, the data reinforce the view that price growth is normalizing, keeping the Fed comfortable with its current easing path.
CPI
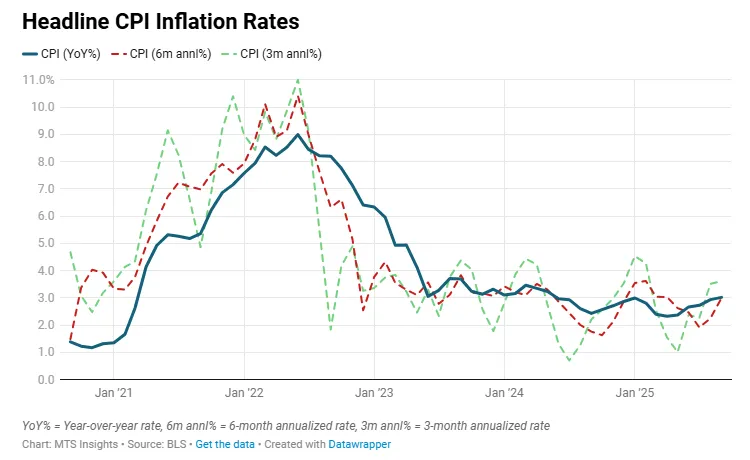
US CPI comes in a bit below expectations in September, rising 0.3% MoM and 3.0% YoY, which is slightly below the expected gains of 0.4% MoM and 3.1% YoY. While the gains were below the consensus estimates, the annual rate was still higher than the 2.9% YoY rate recorded in August and the highest since the first month of this year. The volatile components have played a part in pushing the headline inflation rate higher since it dipped to a near-term low in April.
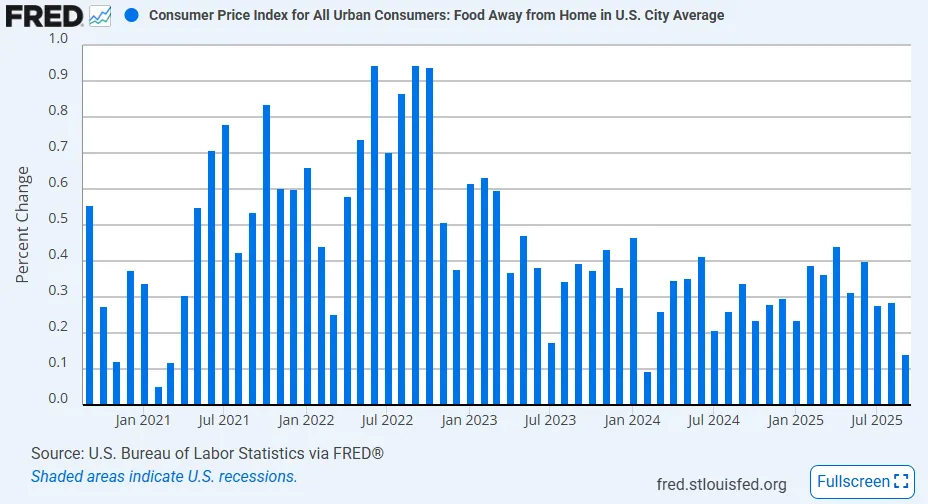
- The general food index increased 0.2% MoM in September, a significantly cooler reading than the 0.5% MoM reading in August. The food at home subsegment increased 0.3% MoM, outpacing the 0.1% MoM increase in food away from home (which was that index’s smallest gain since February 2024). Grocery prices continued to tick higher with 4/6 of the grocery subindexes rising in September, including cereal & bakery products up 0.7% MoM and meats, poultry, fish & eggs up 0.3% MoM. On an annual basis, food prices are up 3.1% YoY, and the food at home index is up 2.7% YoY.
- The general energy index jumped 1.5% MoM in September, the largest monthly rate so far this year. The gain was driven by an increase in gasoline prices that was stronger than the seasonal norms. The not seasonally adjusted increase was 1.1% MoM, but after seasonal adjustment, it was 4.1% MoM. This was mostly caused by the unusual trend of soft gas price gains over the summer, which meant that there was no decline seen in September. Electricity (-0.5% MoM) and natural gas prices (-1.2% MoM) dampened the impact of the rise in gas prices. Importantly, the general energy index is now up 2.8% YoY, the highest since May 2024, which means that the segment has become an upward force on the headline annual rate relative to core inflation.
Core CPI
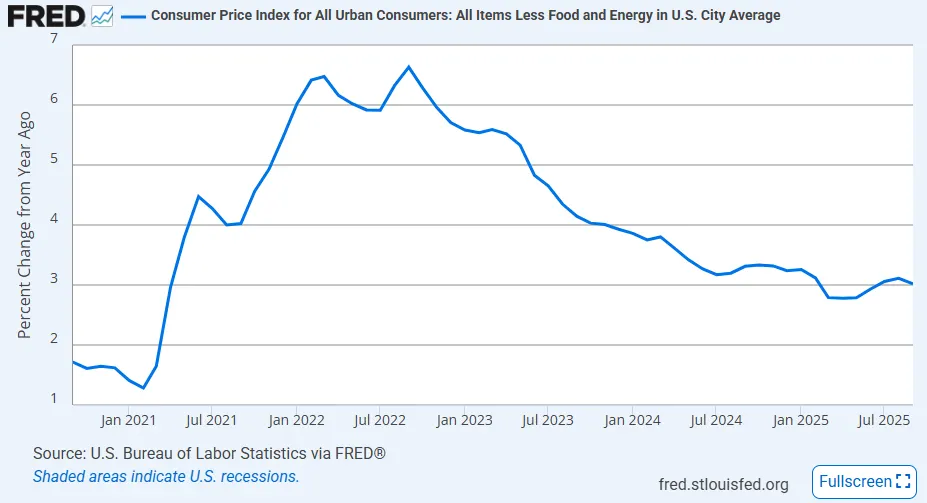
Core inflation also came in below expectations in September, printing at 0.2% MoM and 3.0% YoY, below the consensus estimates of 0.3% MoM and 3.1% YoY. This seems like the more important result of the report, as it suggests that price pressures from tariffs in September have come in below what was expected. The monthly increase of 0.2% MoM is a decline from the 0.3% MoM prints in July and August, and it led to a slight deceleration in the annual rate from 3.1% YoY in August. Both core goods and core services posted smaller monthly gains than the month before, supporting the narrative that tariff inflation is transitory.
- Core goods prices increased 0.2% MoM in September, down from 0.3% MoM in August. Within the segment, there were mixed results among the subgroups. The softer areas, transport goods (0.0% MoM), medical care goods (-0.1% MoM), household goods (+0.2% MoM), and education & communication goods (-0.7% MoM), helped to offset the larger increases in apparel (+0.7% MoM), recreation goods (+0.4% MoM), and other goods (+0.8% MoM). The key used car (-0.4% MoM) and new vehicles (+0.2% MoM) indexes remained contained after looking a bit hotter in the last two months.
- Some of the September data could be interpreted as showing some tariff-related inflation pressures. This is most evident in nondurable consumer goods segments like apparel (+0.7% MoM), sporting goods (+1.0% MoM), personal care products (+0.7% MoM), and pet supplies (+1.0% MoM). Additionally, even though the prices of cars and vehicles didn’t post a notable gain, the auto parts & equipment subindex increased 0.5% MoM and is up 3.1% YoY.
- Core services prices increased 0.2% MoM in September, the lowest since May 2025, suggesting a significant cooling from what was seen over the summer. The shelter index was only up 0.2% MoM, and a softer print here is always going to keep the overall shelter gain contained. All other services subsegments came in with monthly gains between 0.1% MoM and 0.4% MoM, with the largest rise seen in recreation services. On an annual basis, the aggregated core services index was up 3.5% YoY, the smallest since November 2021.
- As just mentioned, the shelter index was up just 0.2% MoM, as the index continues its gradual cooling. This lagging segment continues to post new lows in its annual rates. Specifically, the rent index was up 3.5% YoY, the lowest since October 2021, and the owners’ equivalent rent index was up 3.8% YoY, the lowest since December 2021.
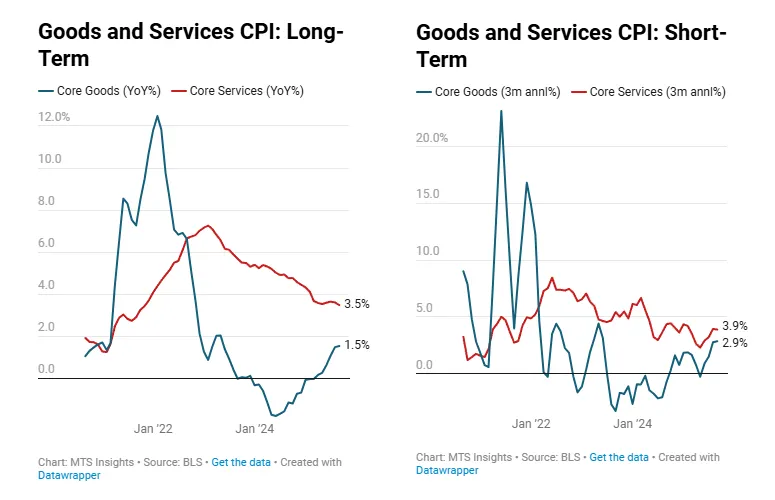
In general, the inflation data in September told a story similar to the data that we saw over the summer. Core goods inflation, which was the first to decline following the COVID inflation spike, is contending with tariff-based inflationary pressures, while core services inflation, which has been stickier following the COVID inflation spike, is gradually declining as wage growth cools and consumers feel less secure in the current economy. Indeed, the commodities index (which does include energy) was up 1.9% YoY in September, the highest since April 2023, and the services index (also including energy) was up 3.6% YoY, the lowest since October 2021.
The downside surprises today were a result of that tariff-related impulse being weaker than expected in September, especially when compared to July and August. Although there are still pockets of upward price pressure, especially in consumer goods categories. That being said, the new tariff threats against China could create a more sustained increase in core goods inflation if they are realized.