

S&P Case Shiller Home Price Index: July 2025
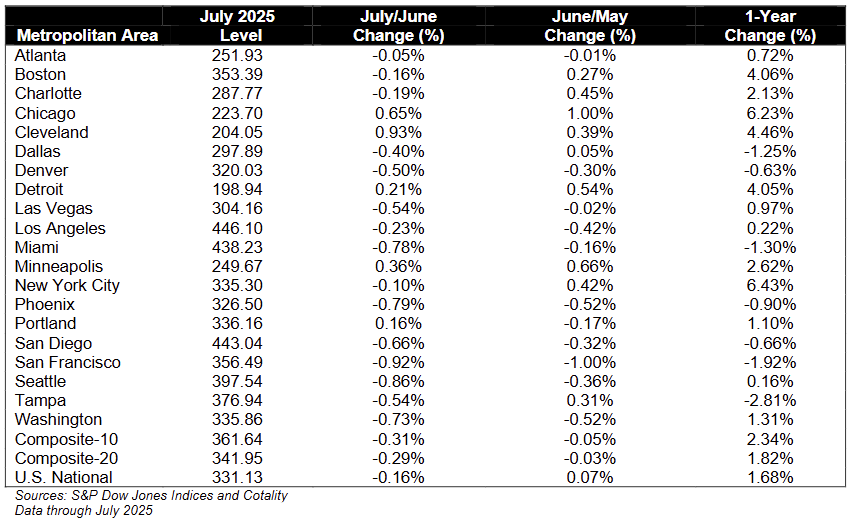
The S&P Case-Shiller U.S. National Home Price Index slipped -0.1% MoM in July 2025 (NSA: -0.2% MoM) and slowed to +1.7% YoY, down from +1.9% YoY in June, underscoring broad cooling despite peak buying season.
- The 20-City Composite fell -0.1% MoM (NSA: -0.3% MoM) and rose +1.8% YoY in July, down from +2.2% YoY in June.
- The 10-City Composite also fell -0.1% MoM (NSA: -0.3% MoM) and gained +2.3% YoY, easing from +2.7% YoY in June.
- National home price growth of +1.7% YoY lagged consumer price inflation (+2.7%), marking the third straight month of real housing wealth decline.
- 15 of 20 major metros recorded MoM price declines before adjustment, highlighting weak demand even in the summer peak.
- New York (+6.4% YoY), Chicago (+6.2%), and Cleveland (+4.5%) led gains, continuing the shift toward more affordable Northeastern and Midwestern markets.
- Tampa (-2.8% YoY), Miami (-1.3%), Phoenix (-0.9%), and San Francisco (-1.9%) posted the steepest declines, reflecting a reversal of pandemic-era winners.
- High-cost Western metros such as Los Angeles (+0.2% YoY) and San Diego (-0.7%) showed little to no growth, underscoring affordability constraints.