
Monthly Energy Statistics: September 2025
OECD
In June 2025, total net electricity generation in the OECD reached 922.6 TWh, an increase of 1.4% compared to June 2024. Of this total, 416.8 TWh (45.2%) was produced from fossil fuels, 358.6 TWh (38.9%) from renewable sources and 143.2 TWh (15.5%) from nuclear power.
Electricity generation from fossil fuels decreased by 1.8% year-on-year in the OECD in June 2025. Electricity generation from natural gas decreased by 2.1% year-on-year (-5.5 TWh), and generation from coal decreased by 1.3% year-on-year (-1.9 TWh). The shares of natural gas, coal and oil as a percentage of total electricity generation were 28.6%, 14.9% and 1.2%, respectively. The decrease in electricity generation from natural gas was driven by OECD Asia Oceania (-8.4% y-o-y, -3.2 TWh) and OECD Americas (-1.7% y-o-y, -3.3 TWh), while generation increased in OECD Europe (3.0% y-o-y, +1.0 TWh).
Electricity generation from renewable sources increased by 7.3% year-on-year (+24.4 TWh) in the OECD in June 2025. The highest absolute increase came from solar power generation (+24.7% y-o-y, +23.5 TWh), bringing total OECD solar generation to 118.7 TWh (12.9% of total generation). The highest year-on-year increase was in the OECD Americas, where solar power generation increased by 28.6% year-on-year (+10.2 TWh) to 46.0 TWh, driven by the United States (+32.3% y-o-y, +10.0 TWh). In OECD Europe, solar power generation increased 25.0% year-on-year (+10.8 TWh) to 53.9 TWh. The notable increase was in Lithuania with 303% year-on-year (+0.4 TWh) and +288% year-to-date (+1.2 TWh). In OECD Asia Oceania solar power generation increased by 15.2% year-on-year (+2.5 TWh). Wind generation increased 8.8% year-on-year (+7.3 TWh), bringing total OECD wind power generation to 89.7 TWh (9.7% of total generation). On the other hand, hydropower generation in the OECD decreased by 2.7% year-on-year (-3.8 TWh) to 135.2 TWh (13.3% of total generation). Hydropower generation in OECD Europe decreased by 5.3% year-on-year (-6.8 TWh).
Nuclear power generation decreased 2.3% year-on-year (-3.4 TWh) in the OECD in June 2025. OECD Asia Oceania registered a constant nuclear generation year-on-year. Nuclear power production in OECD Europe and the OECD Americas decreased 2.7% (-1.4 TWh) and 2.7% (-2.0 TWh) year-on-year, respectively.
Highlight of the month
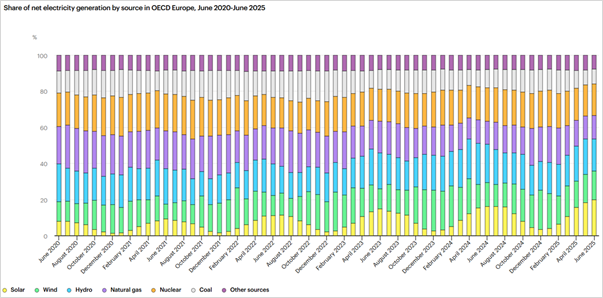
In June 2025, solar power became the leading source of electricity in OECD Europe for the first time, contributing 19.9% (53.9 TWh) of net electricity generation. Together, solar and wind reached a record share, supplying 35.8% (97.0 TWh) of total electricity production.