
US Trade Price Indexes: August 2025
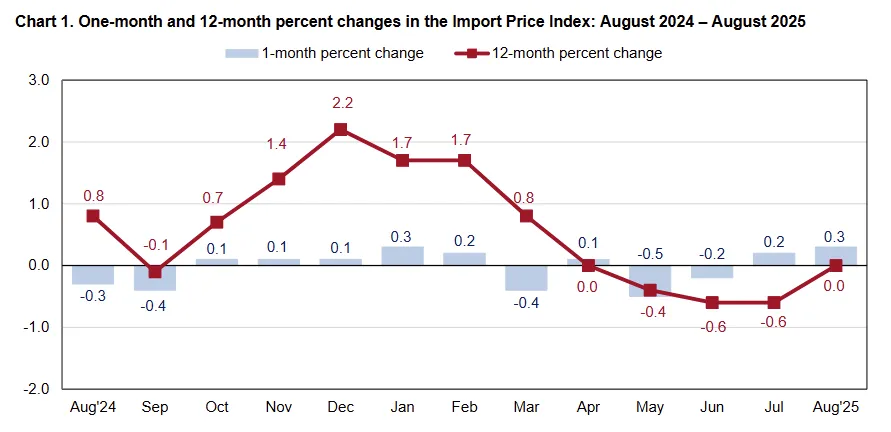
US trade prices saw increases in August that were ahead of expectations. Import prices increased 0.3% MoM in August, the largest increase since January and above expectations of a -0.1% MoM decline. The rise came despite a -0.8% MoM drop in fuel imports, meaning that nonfuel import prices increased 0.4% MoM, the largest monthly growth since April 2024. The key subsegment driving the increase was import prices of industrial supplies & materials (ex fuels) which jumped 1.0% MoM, specifically driven by import durable goods supplies, up 1.2% MoM. Outside of that hot rise, capital goods import prices increased 0.5% MoM and consumer goods (ex autos) import prices were up 0.7% MoM. Tariffs are not directly measured by these indices, but it is possible that tariff-related pressures on supply chains are causing an increase in import prices.
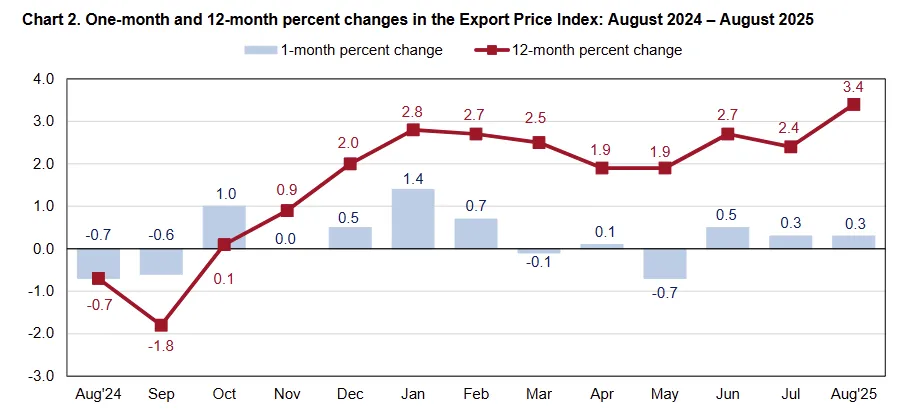
The export price index also came in hotter-than-expected, rising 0.3% MoM in August when the forecast was for no growth. The advance was concentrated in nonagricultural exports (+0.4% MoM), with consumer goods leading the way (+0.6% MoM) on higher prices for apparel, household goods, and jewelry. Capital goods prices rose 0.2% MoM, supported by gains in industrial machinery, aircraft and parts, and semiconductors, while automotive vehicles also edged up 0.2% MoM on stronger demand for non-engine parts. Export prices for nonagricultural industrial supplies and materials increased 0.2% MoM, with the nonagricultural supplies & materials (ex fuels) jumping 1.1% MoM and 9.7% YoY offset by a -0.8% MoM drop in fuels & lubricants export prices. Agricultural export prices were flat overall, with fruit price gains offsetting declines in nuts and soybeans.