


US PPI: July 2025
Headline PPI
The headline US final demand PPI printed very hot in July, rising 0.9% MoM and beating the forecast of a 0.2% MoM by a substantial margin. This move is the largest monthly gain since one of an equal size was reported in June 2022. On an annual basis, headline PPI was up 3.3% YoY, a reacceleration from the weaker prints of the three months before and the highest since February of this year. Even when excluding food and energy, PPI was still up 0.9% MoM, which is also the highest reading for that segment in over three years.
Goods
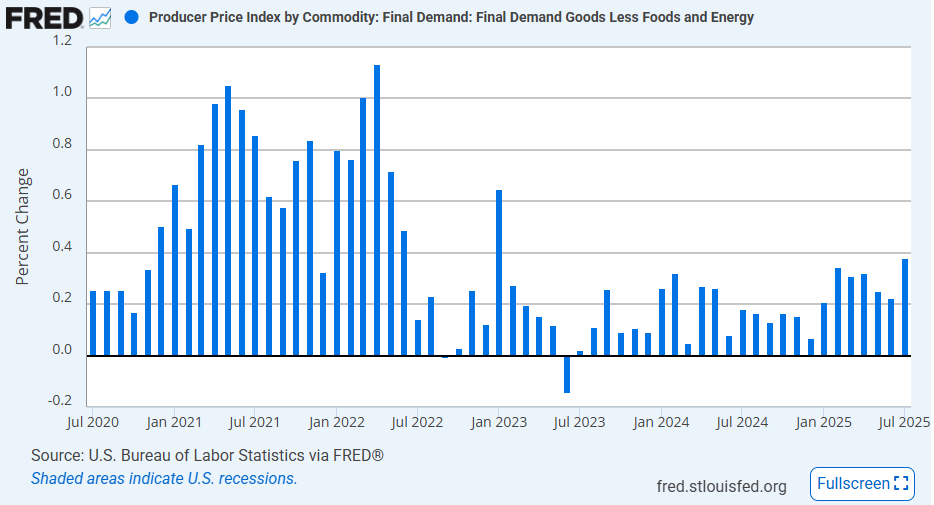
The goods segments are the focus for analysts poring over the latest data as they look for evidence that tariffs are impacting prices. The July report might give them just that. The final demands goods PPI jumped 0.7% MoM, the largest increase since January, but more importantly, the core goods PPI was up 0.4% MoM, the largest increase since January 2023. But first, let’s look at the volatile components:
- The final demand energy goods segment increased 0.9% MoM for the second straight month in July. Energy prices were low for the first half of the year, and are starting to show signs of reflating (though not to a significant degree). In the July report, the subindexes tracking government purchased energy goods (+4.9% MoM) and exported energy goods (+4.5% MoM) saw very large gains which offset a slight decline of -0.1% MoM in finished consumer energy foods. The key thing to note is that energy will not be a significant source of deflation going forward and will, at best, remain flat.
- The final demand foods segment jumped 1.4% MoM in July, the largest since a 1.6% MoM rise in June. Apparently, a surge in vegetable prices played a major part in the strong rise in food prices and even in the overall goods segment: “A quarter of the July advance in the index for final demand goods can be traced to prices for fresh and dry vegetables, which jumped 38.9% MoM.” There were also hot prints for eggs (+7.3% MoM), beef & veal (+4.6% MoM), and processed turkeys (+5.1% MoM). Coffee increased another 1.1% MoM and is now up 29.2% YoY. The surge there and in the vegetable index do appear to be evidence of tariff impacts.
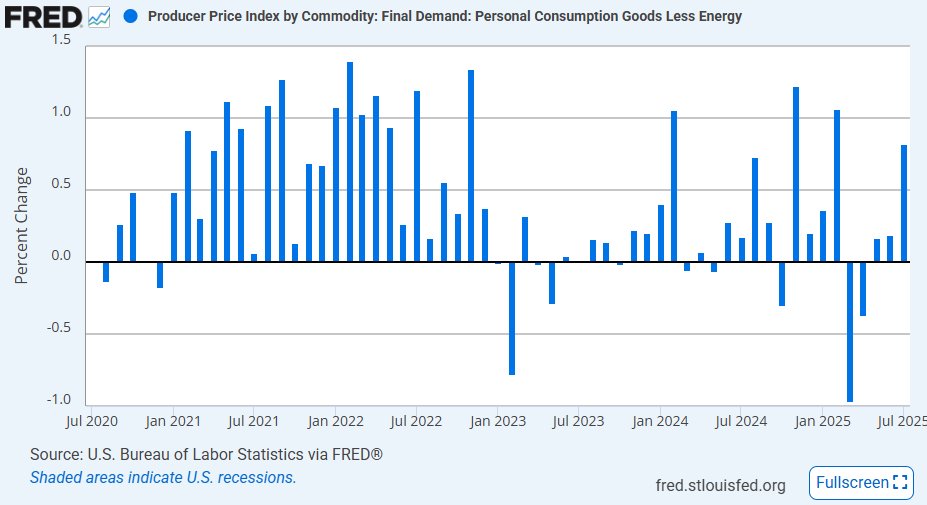
Outside of the two volatile components, there were several categories that suggested tariffs were increasing costs for producers. The subindex tracking iron & steel scrap increased 4.5% MoM in July, building off of the 3.2% MoM rise in June. Steel has been targeted specifically with a steep 25% tariff. Home electronic equipment PPI surged 5.0% MoM after a 0.8% MoM rise previously and is now up 6.5% YoY. Other nondurable goods categories that are related to consumer goods imports saw strong rises as well: textile house furnishings (+2.3% MoM), sporting & athletic goods (+1.2% MoM), household furniture (0.4% MoM), and household appliances (+0.6% MoM). The general move is summarized well by the personal consumption goods (less energy) PPI which increased 0.8% MoM in July, the strongest move since a 1.1% MoM rise in February, when the first tariffs were introduced.
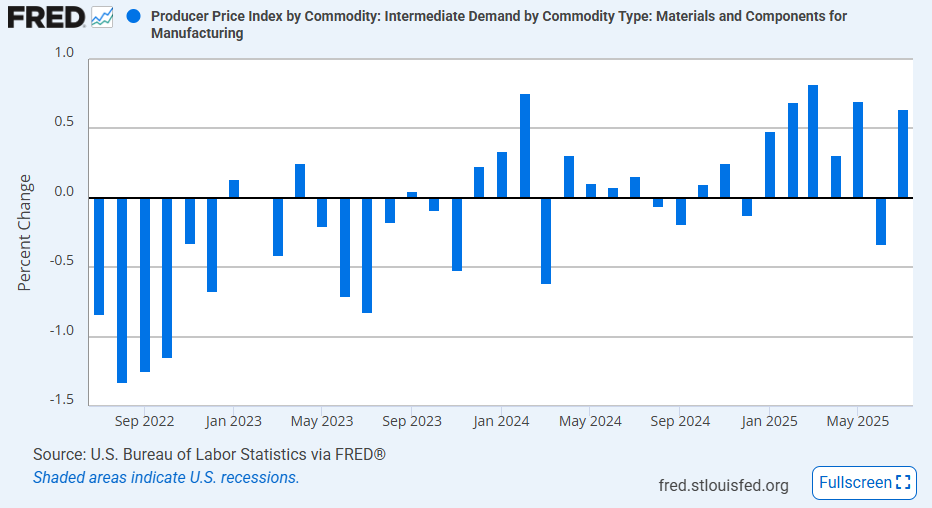
The impacts were not only evident in the finished goods price data, but also in the intermediate goods price data. Both the PPI for processed intermediate goods and the PPI for unprocessed intermediate goods increased in July, by 0.8% MoM and 1.8% MoM, respectively. This includes increases in the costs of goods flowing into US manufacturing firms. The materials for manufacturing index increased 0.8% MoM driven by a 1.3% MoM rise in materials for durable manufacturing (which is now up 7.2% YoY). Unprocessed material costs (ex food and fuels) have seen robust gains in the last two months as well, up 3.3% MoM in June then 1.1% MoM in July. The report today shows that tariff impacts are showing up across all segments of the supply chain.
Services
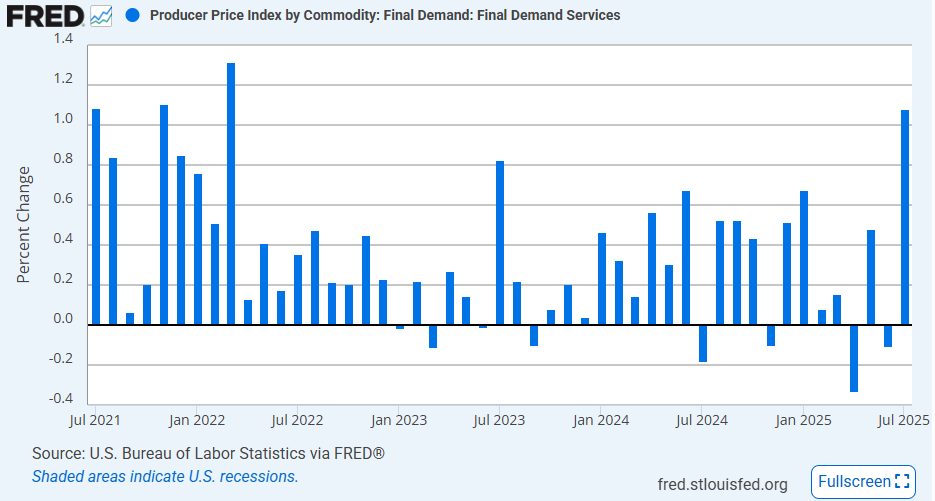
Alongside the rise in goods PPI was an even larger rise in the services PPI. Final demand services PPI increased 1.1% MoM, the largest increase in over three years. On an annual basis, final demand services was up 4.0% YoY in July, a sharp acceleration from 2.7% YoY in June. PPI of services for intermediate demand also saw a hot print, up 0.8% MoM, the strongest increase since January 2023. What stuck out as being a reaction to tariffs in the services PPI data was a sharp increase in trade services PPI.
Final demand trade services surged 2.0% MoM in July and accounted for over half of the rise in the overall services PPI move. More specifically, 30% of the overall services PPI rise is attributed to a 3.8% MoM increase in margins for machinery and equipment wholesaling. This sharp gain in wholesale margins reflects both stronger demand in certain capital goods markets and rising replacement costs tied to tariff-affected imports. Recent tariff rounds have increased the landed cost of many machinery components and finished equipment sourced from abroad, prompting wholesalers to lift margins to protect profitability. As these higher input costs work their way through supply chains, they are likely to place additional upward pressure on producer prices, and potentially consumer prices, in the coming months.