


US Personal Income and Outlays: January 2025
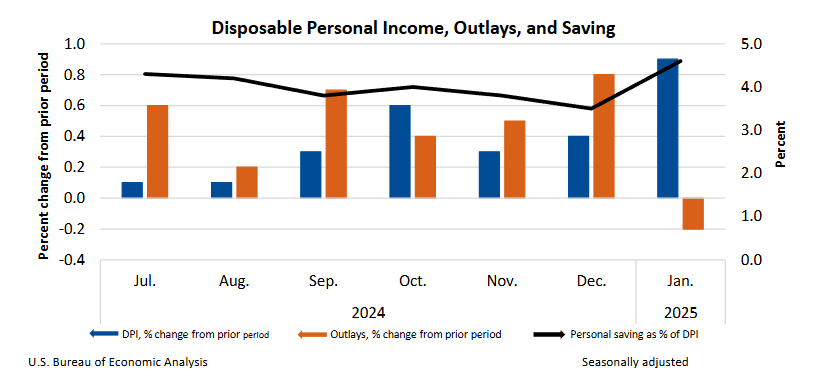
Personal income jumped 0.9% MoM (vs 0.3% MoM expected), and personal spending fell -0.2% MoM (vs 0.1% MoM expected) in January, the weakest since an -0.6% MoM drop in February 2021.
- Wages and salaries were up 0.4% MoM while supplements to compensation jumped 0.6% MoM.
- Disposable personal income jumped 0.9% MoM, the largest increase since January 2024.
- Goods spending was down -1.2% MoM with durables spending down -3.0% MoM and nondurables down -0.2% MoM, and services spending was up 0.3% MoM.
- Real consumer spending was down -0.5% MoM, also the weakest since February 2021.
- The drop in spending was a result in a large -$41.1 billion decline in motor vehicle & parts spending and a -$14.9 billion drop in spending on recreation goods.
- This was offset by increase in spending on housing & utilities (+$29.0 billion) and food services and accommodations (+$13.0 billion), the two largest segments of spending growth in January.
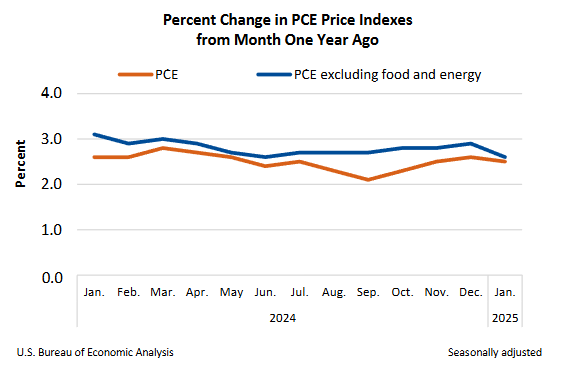
The PCE price index increased 0.3% MoM and 2.5% YoY, in line with expectations.
- The energy index jumped 1.3% MoM and was up 1.0% YoY, the first positive annual rate since July 2024.
- Food prices saw a moderate increase of 0.3% MoM and were up 1.6% YoY.
- Core PCE inflation was 0.3% MoM and 2.5% YoY (down from 2.6% YoY previously), both also in line with expectations.
- Goods prices advanced 0.5% MoM on strong energy with durables up 0.3% MoM and nondurables up 0.6% MoM. Goods annual rate was 0.6% YoY, the first positive reading in around a year.
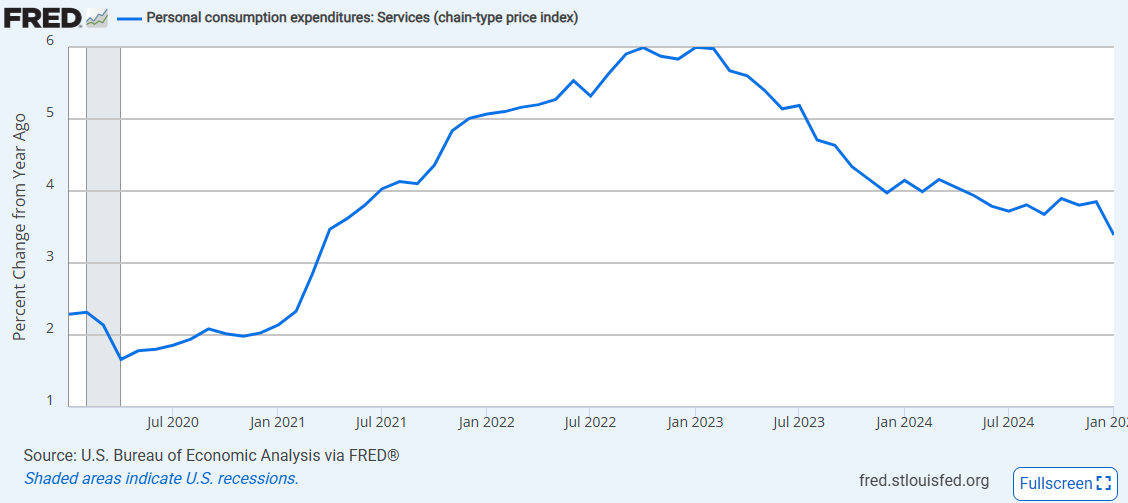
- Services prices were only up 0.2% MoM and the annual rate eased to 3.4% YoY (from 3.9% YoY previously), the lowest since March 2021.