


US GDP: Q1 2025 (3rd Estimate)
GDP Growth
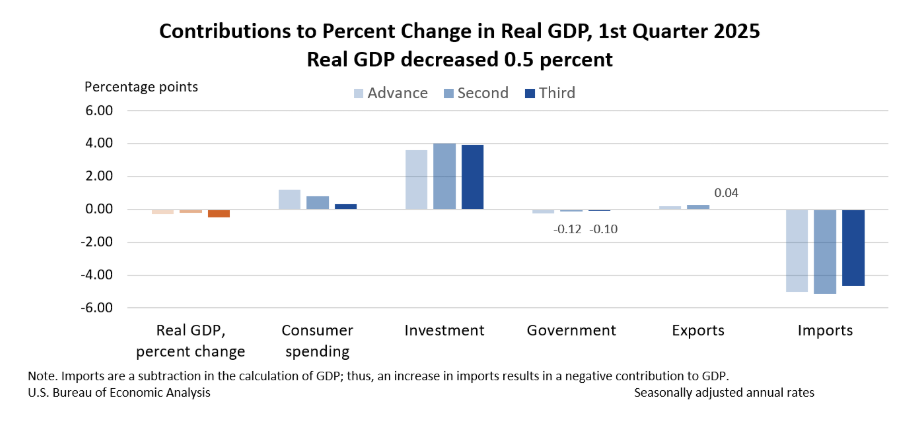
Economic growth in the first quarter of 2025 was revised down significantly in the third and final estimate released today. After the second estimate, real GDP growth was reported at -0.2%, up slightly from -0.3% in the advance estimate. The upgrade has been reversed and more as the final estimate of real GDP growth in Q1 2025 landed at -0.5% as the contributions of consumption, investment, and net exports were all revised down.
- Personal consumption expenditure (PCE) growth was revised down from an SAAR of 1.2% in the second estimate to just 0.5% in the final estimate which means that consumption contributed just 0.31 ppts to headline GDP growth, the lowest since consumer spending saw a massive contraction during the pandemic, and before that, since Q2 2011. The downward revision in spending was entirely in expenditures on services which grew at a rate of just 0.6% as opposed to the 1.7% growth in the second estimate.
- Private domestic investment growth was still reported as strong, at 23.8%, but slightly weaker than the last estimate of 24.4%. Residential investment appears to have contracted more than previously thought, declining at a SAAR of -1.3%, down from the -0.6% in the 2nd estimate. The inventory component of growth was also revised in the final estimate, down -5 bps to 2.59 ppts. Compared to consumption, the revisions in investment were not as significant.
- Offsetting some of the negative revisions was an upward shift in the estimate of the contribution from net exports. The second estimate found it at -4.90 ppts with a surge in imports dragging growth down by -5.16 ppts, offset by exports contributing 0.26 ppts. In the final estimate, the BEA found that trade activity was lower overall but in a way that was favorable to GDP growth. The net exports contribution has landed at -4.61 ppts now with exports revised down to 0.04 ppts but imports revised up to -4.66 ppts.
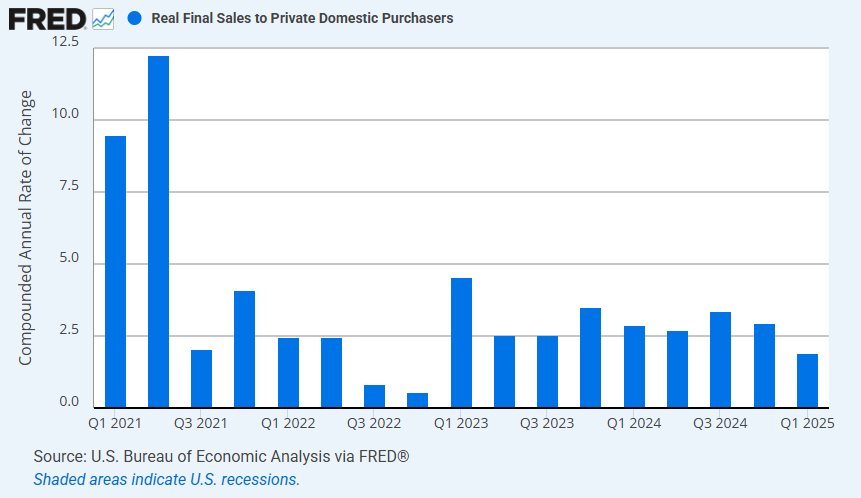
The obvious focus of the GDP revisions is on the newfound weakness in personal consumption which will cause many to reassess their views of the strength of the US economy in Q1 2025. Consider the change to private domestic final purchases (PDFP), a measure that excludes net exports which Fed Chair Powell has referred to in supporting his (and the Fed’s) view that the economy was still solid in Q1. The second estimate had PDFP growth at 2.5% (already revised down from the advance estimate of 3.0%), but that has now been revised down to just 1.9% in the final estimate, the first time this measure fell below 2% since Q4 2022.
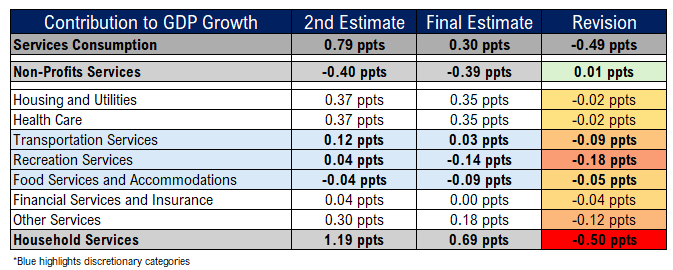
The fact that this downward revision was rooted in weak services spending suggests that softer growth had little to do with tariffs and more to do with a decline in consumer sentiment and financial health. In fact, when looking at GDP contributions by industry, the discretionary services segments stick out as having the largest downward revisions: recreation services downgraded -18 bps to -0.14 ppts, food services & accommodations downgraded -5 bps to -0.09 ppts, transportation services downgrade -9 bps to -0.03 ppts. These three industries accounted for about 65% of the downward revision in the contribution from services consumption growth.
PCE Inflation
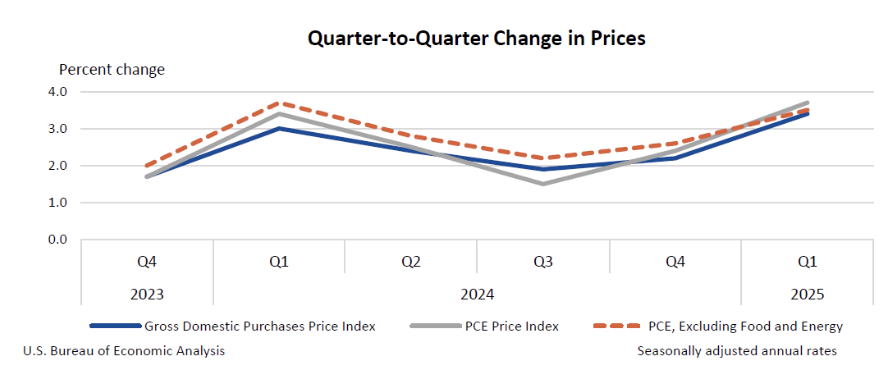
While growth was revised down, the measures of prices in the GDP report were revised up. Both the headline and core PCE inflation SAAR were revised up 0.1 ppts to 3.7% and 3.5%, respectively. However, the YoY rates for both data points were unchanged at 2.5% YoY and 2.8% YoY. The changes in the price data were much less significant than the growth revisions, and the more important update on price data will come tomorrow when the May personal income and outlay reports come out. Regardless, it is not good news to see price data revised up, even if slightly, in the same report as a significant downward adjustment in consumption. This only further complicates the Fed’s task of navigating upside risks to inflation coinciding with downside risks to employment.
Here are some other highlights from the final GDP estimate:
- While gross domestic product growth was revised down, the estimate of gross national income (GNI) was revised up, from a -0.2% decline in the second estimate to an increase of 0.2% in the final estimate. This is odd because GDP and GNI growth are meant to track each other pretty closely, so a divergence in a revised report like this raises some eyebrows. One reason for a deviation could be that foreign incomes increased relative to domestic incomes. This could be a suggestion that the introduction of tariffs had an immediate negative impact on domestic profits while foreign operations fared better.
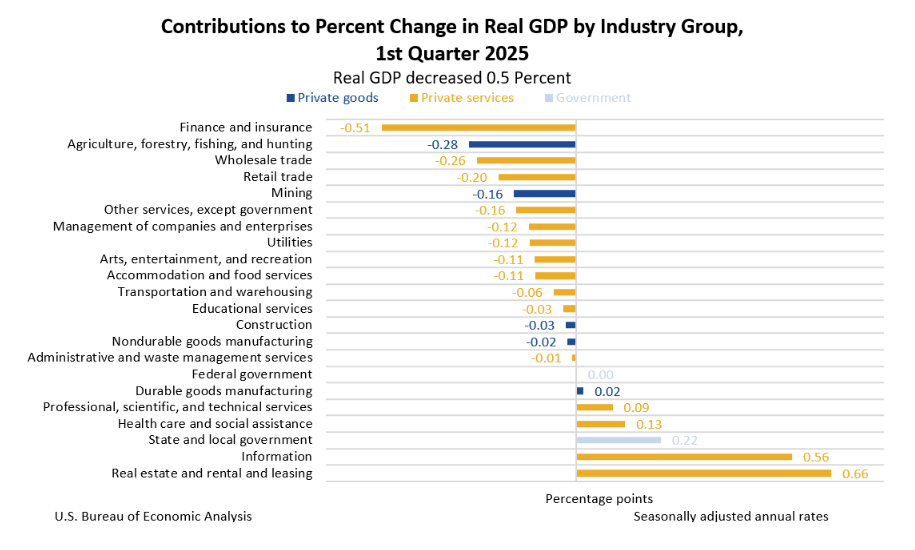
- The final estimate of growth includes a breakdown by industry. The BEA found that goods sector real value added dropped at an SAAR of -2.8% while the decline in services was just -0.3%. However, the latter was boosted by two industries: information (0.56 ppts GDP contribution) and real estate (0.66 ppts GDP contribution). Value added from government increased at a SAAR of 2.0% with all of that coming from state and local governments. The BEA found that the federal government made no contribution to GDP in Q1 2025.