
 CoStar Apartment Monthly Rent Report
- Source
- CoStar
- Source Link
- https://www.costargroup.com/
- Frequency
- Monthly
- Next Release(s)
- April 30th, 2026 10:00 AM
Latest Updates
-
CoStar Apartment Monthly Rent Report: March 2026

-
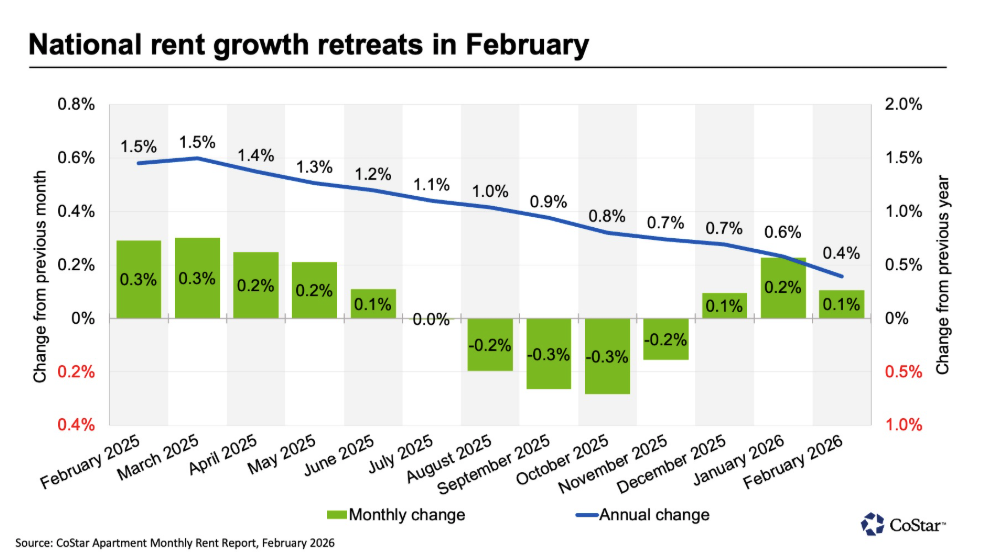
U.S. apartment rents increased +0.1% MoM to $1,716 in February 2026 while YoY growth slowed to +0.4%, indicating modest monthly gains amid elevated supply pressures.
-
The national average rent rose to $1,716 (+0.1% MoM) from a revised $1,714 in December, extending the positive monthly trend that began in December after five months of flat or declining rent changes.
-
Annual rent growth eased to +0.4% YoY (Jan: +0.6%; Feb 2025: +1.5%), indicating continued deceleration in rent growth relative to the stronger pace seen a year earlier.
-
February’s +0.1% MoM increase was below the typical seasonal February gain of about +0.3% observed between 2010 and 2025, suggesting weaker-than-normal seasonal momentum in rent growth.
-
Metro-level breadth weakened slightly as 38 of the top 50 markets posted MoM rent increases in February, down from 42 markets in January, indicating somewhat narrower participation in the monthly gains.
-
The strongest monthly rent increases occurred in Richmond (+0.8% MoM), San Jose (+0.6%), and Louisville (+0.6%), highlighting pockets of stronger rent growth across select markets.
-
The largest monthly declines were recorded in Nashville (-0.2% MoM) and several Sun Belt markets including Charlotte, Tampa, Houston, Austin, Orlando, Seattle, and Orange County (-0.1% each), reflecting elevated vacancies tied to new supply.
-
On a YoY basis, the strongest rent growth occurred in San Francisco (+5.7%), Norfolk (+4.1%), San Jose (+3.5%), and Chicago (+3.0%), indicating stronger performance in markets with tighter supply conditions.
-
By contrast, Austin (-5.1% YoY), Denver (-3.4%), and Phoenix (-3.3%) recorded the largest annual rent declines, reflecting supply growth outpacing demand in those markets.
-
-
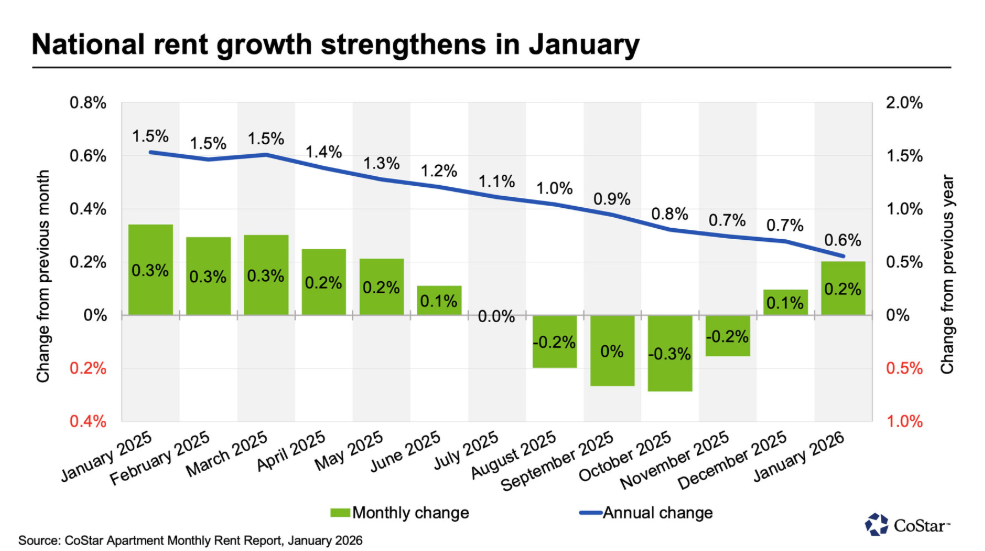
U.S. apartment rents rose +0.2% MoM in January 2026 to $1,713 while YoY growth eased to +0.6%, reflecting a seasonal rebound amid elevated supply.
-
The national average rent increased to $1,713 from a revised $1,709 in December (+0.2% MoM), extending the return to positive monthly growth that began in December after five months of flat or declining rents.
-
Annual rent growth slowed slightly to +0.6% YoY (Dec: +0.7%) and remained well below the +1.5% pace seen in January 2025, indicating continued deceleration despite improving monthly momentum.
-
All four regions posted MoM increases, led by the Midwest (+0.27%), followed by the Northeast (+0.21%), South (+0.17%), and West (+0.09%), pointing to broad-based seasonal firming.
-
On a YoY basis, the Midwest (+2.1%) and Northeast (+1.4%) outperformed, while the South (-0.2%) and West (-1.5%) continued to see annual rent declines tied to heavier supply.
-
Metro-level breadth improved, with 42 of the top 50 markets recording MoM increases in January, up from 25 markets in December, suggesting strengthening participation in the rebound.
-
The strongest monthly gains were seen in San Francisco (+1.07%), Norfolk (+0.80%), and San Jose (+0.71%), while declines were concentrated in Oklahoma City (-0.17%), Louisville and Memphis (-0.06%), and Houston and Salt Lake City (-0.4%).
-
Annual performance remained polarized, led by San Francisco (+6.3%), Norfolk (+4.3%), and San Jose (+3.5%), while Austin (-4.8%), Denver (-3.3%), and Phoenix (-3.3%) lagged amid oversupply pressures.
-
-
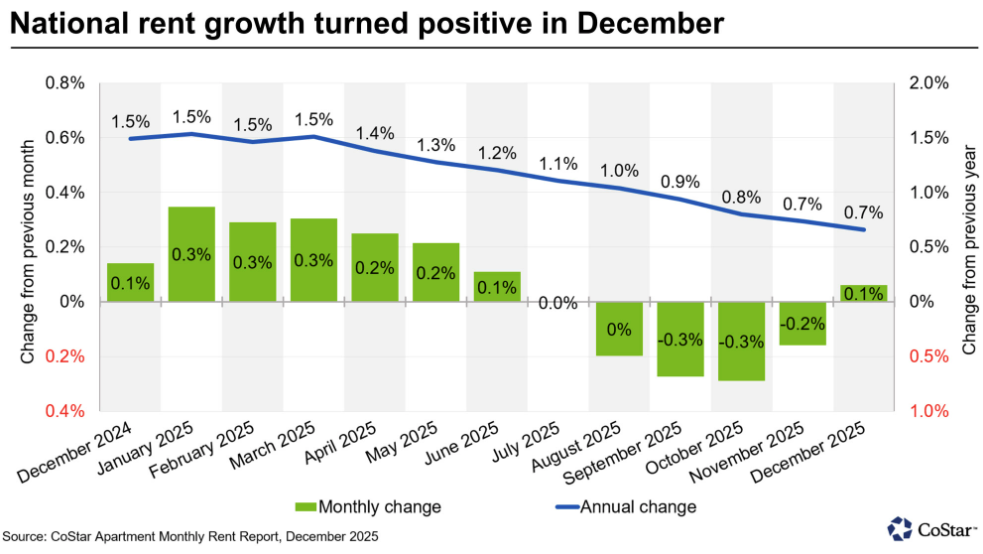
U.S. apartment rents rose +0.1% MoM in December 2025 to $1,708 while YoY growth eased to +0.66%, marking a seasonal rebound after five months of flat or declining rents.
-
The national average increased to $1,708 from a revised $1,707 in November (+0.1% MoM), snapping a five-month streak of flat or negative monthly rent changes.
-
Annual rent growth slowed to +0.66% YoY from +0.74% in November and from +1.5% at the start of 2025, indicating continued deceleration despite the MoM uptick.
-
Regionally, the Midwest led with a +0.12% MoM increase, followed by the South (+0.07%) and Northeast (+0.06%), while the West remained slightly negative at -0.01% MoM.
-
On a YoY basis, the Midwest (+2.2%) and Northeast (+1.5%) outperformed, while the South (-0.1%) and West (-1.4%) continued to post annual rent declines.
-
Metro-level performance broadened, with 25 of the top 50 markets posting MoM increases in December, up from just seven in November, signaling improving breadth.
-
The strongest monthly gains were in San Francisco (+0.64%), Norfolk (+0.53%), and Richmond (+0.42%), while the steepest declines were in Portland (-0.29%) and several Mountain West and Sun Belt metros (-0.21% to -0.26%).
-
On an annual basis, San Francisco led at +5.9% YoY, followed by Norfolk (+3.8%) and Chicago and San Jose (both +3.4%), while Austin (-4.6%), Denver (-3.4%), and San Antonio (-3.3%) lagged due to elevated supply.
-
Elevated but easing inventory continues to weigh on rents nationally, with weaker performance concentrated in markets facing heavy new construction and, in some cases, declining employment.
-
-
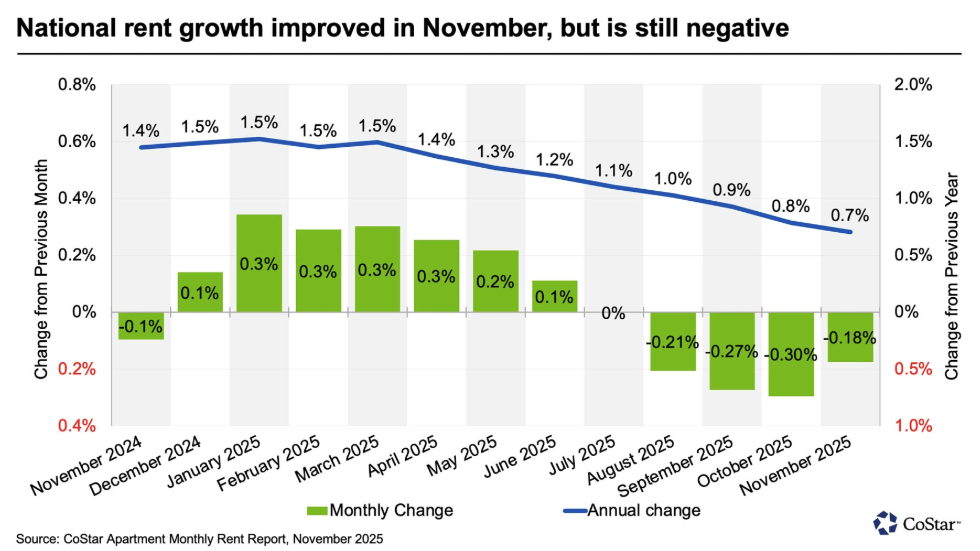
U.S. multifamily rents fell -0.18% MoM in November 2025 to $1,706 (from a revised $1,709), marking the fifth straight month of flat or negative rent change and the steepest November decline in more than 15 years, while YoY rent growth slowed to 0.7% (from 0.8% in October).
-
All four regions posted MoM rent declines for a fourth consecutive month: West -0.4%, South -0.2%, Northeast -0.1%, and Midwest -0.01%, indicating broad seasonal and supply-driven pressure.
-
On a YoY basis, the Midwest +2.2% and Northeast +1.7% led national performance, while the South -0.1% and West -1.5% saw declines, reflecting persistent oversupply challenges in Sun Belt and Western metros.
-
Only seven metros recorded positive MoM rent change, with Louisville, Kansas City, and Norfolk each rising +0.1%, highlighting limited pockets of resilience.
-
The largest monthly declines were in Las Vegas (-0.8%), San Antonio (-0.7%), Austin (-0.7%), and Denver (-0.7%), as high vacancy and aggressive new construction continue to weigh on Mountain West and Sun Belt markets.
-
Additional markets with notable softness included Salt Lake City, Raleigh, and Portland (-0.6% each), with Las Vegas and Portland also constrained by weakening local employment conditions.
-
Annual rent leaders were San Francisco (+5.6%), San Jose (+3.6%), Chicago (+3.4%), and Norfolk (+3.3%), underscoring outperformance in more supply-constrained coastal and Midwestern metros.
-
The weakest YoY performers were Austin (-4.7%), Denver (-3.6%), and Phoenix (-3.2%), where elevated inventory continues to outstrip demand.
-
Overall, November data shows a market still pressured by high supply, with seasonal softness moderating but not reversing, as outperforming metros remain those with tighter construction pipelines and steadier demand.
-
-
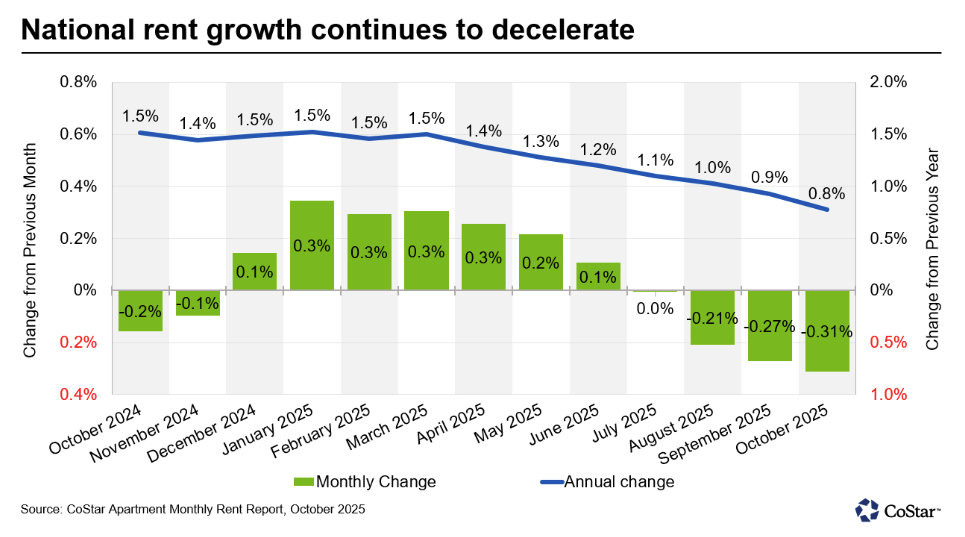
U.S. multifamily rents fell -0.3% MoM in October 2025 to a national average of $1,708 (from $1,713), marking the steepest October decline in over 15 years and the fourth straight month of flat or negative rent change.
- Annual rent growth slowed to +0.8% YoY (from +0.9% in September), reflecting continued pressure from elevated supply levels.
- The national average rent decline was more than twice the historical October average (-0.15% vs +0.07% pre-2020), reinforcing the sharper seasonal downturn that has persisted since 2022 amid strong new supply.
- All regions saw monthly rent decreases: the West (-0.53%) led, followed by the South (-0.28%), Northeast (-0.24%), and Midwest (-0.18%).
- On a YoY basis, the Midwest (+2.2%) and Northeast (+1.8%) remained positive, while the South was flat and the West fell -1.4%.
- Only two metros, Las Vegas and Milwaukee, recorded monthly gains (+0.2%), while Miami and Norfolk were unchanged.
- The sharpest monthly drops were in Denver (-1.3%), Austin (-1.1%), Seattle (-0.9%), Salt Lake City (-0.8%), and Phoenix (-0.8%), all markets facing heavy new supply and higher vacancy rates.
- San Francisco (+5.8%), San Jose (+3.8%), Chicago (+3.6%), and Norfolk (+3.0%) led annual rent growth, contrasting with declines in Austin (-4.6%), Denver (-3.7%), and San Antonio (-2.7%).
- The report noted that oversupply remains the primary drag on rent momentum, while more supply-constrained markets, particularly in the Midwest and select coastal metros, continue to outperform.
-
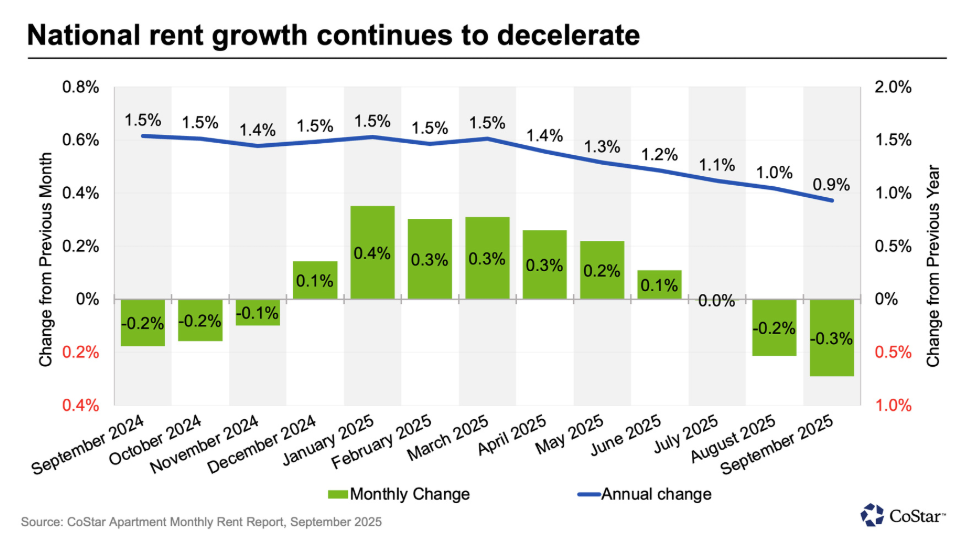
U.S. multifamily rents fell -0.3% MoM in September 2025 to a national average of $1,712 (from $1,717), marking the steepest September decline in over 15 years and the third straight month of flat or negative rent change. Annual rent growth slowed to +0.9% YoY (from +1.0% in August), continuing a steady deceleration since the start of the year.
-
The September decline exceeded typical seasonal softness, with rent losses from peak levels surpassing 2024 both in dollar and percentage terms, underscoring deeper market moderation.
-
All four regions posted MoM declines: the West (-0.5%) led, followed by the South (-0.4%), Northeast (-0.2%), and Midwest (-0.1%).
-
On a YoY basis, the Midwest (+2.4%) and Northeast (+1.9%) led rent growth, while the South was nearly flat (+0.1%) and the West declined -1.3%.
-
Only Milwaukee (+0.1%) and Cleveland (+0.02%) recorded monthly rent increases, while other metros softened.
-
The sharpest monthly declines were in Denver (-1.3%), Raleigh (-1.2%), San Antonio (-0.9%), and Salt Lake City (-0.8%), all affected by high vacancy and new supply.
-
San Francisco (+6.1%), San Jose (+3.8%), Chicago (+3.8%), and Norfolk (+3.1%) led annual rent growth, contrasting with steep YoY drops in Austin (-4.4%), Denver (-3.8%), Phoenix (-2.9%), and San Antonio (-2.9%).
-
The report noted that oversupply remains the main factor suppressing rent growth, while supply-constrained metros, especially in the Midwest and select coastal markets, continue to outperform.
-
-
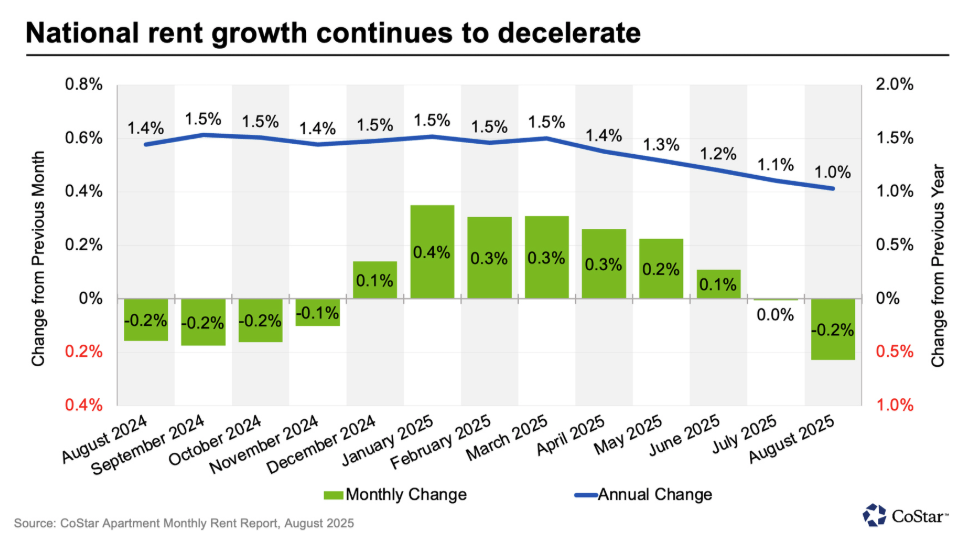
U.S. multifamily rents fell -0.23% MoM in August 2025 to a national average of $1,713 (from $1,719), marking the second consecutive monthly decline and the first drop over 20 bps since January. Annual rent growth eased to +1.0% YoY (from +1.1% in July), continuing the gradual deceleration seen through 2025.
-
The rent pullback from peak levels through August was sharper than in 2024, both in dollar and percentage terms, indicating that this year’s moderation is more pronounced than typical seasonal softening.
-
All four regions recorded MoM declines: the West (-0.5%) led, followed by the South (-0.4%), Midwest (-0.2%), and Northeast (-0.1%).
-
On a YoY basis, the Midwest (+2.5%) and Northeast (+2.2%) remained the strongest-performing regions, while the West declined -1.3%.
-
Only a few metros posted monthly rent gains, led by San Francisco (+0.6%), Orange County (+0.3%), and Northern New Jersey (+0.1%), with Norfolk and New York flat.
-
The largest monthly drops were in Richmond (-1.1%), Austin (-1.1%), Las Vegas (-1.0%), and San Antonio (-0.9%), all Sun Belt markets facing high vacancy and elevated new supply.
-
San Francisco (+6.2%), Chicago (+3.9%), San Jose (+3.5%), and New York (+2.8%) led annual rent growth, while Austin (-4.7%), Denver (-3.5%), and Phoenix (-3.1%) showed the steepest yearly declines.
-
The report noted that oversupply continues to weigh on rent growth, with more supply-constrained markets, particularly in the Midwest and select coastal metros, continuing to outperform.
-
-
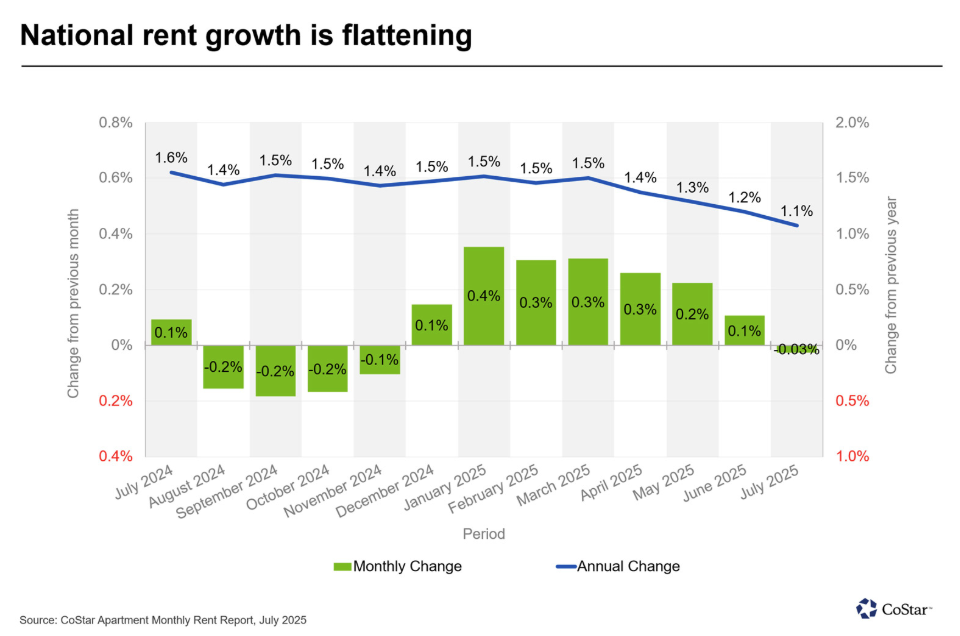
U.S. multifamily rents were unchanged MoM in July 2025 at a national average of $1,717 (-0.03%), marking the sixth straight month of flat or negative growth and signaling continued moderation in rent momentum. Annual rent growth slowed to +1.1% YoY (from +1.5% in January), reflecting persistent supply pressures and cooling demand.
-
Regional differences widened, with the Midwest (+0.06% MoM, +2.6% YoY) and Northeast (+0.03% MoM, +2.2% YoY) continuing to outperform the South (-0.08% MoM, +0.3% YoY) and West (-0.22% MoM, -1.1% YoY).
-
Over half of the 50 largest apartment markets posted monthly declines, suggesting ongoing softness as seasonal demand eases and new supply remains elevated.
-
San Francisco led monthly rent gains (+0.43%), followed by Orange County (+0.40%), Oklahoma City (+0.37%), Norfolk (+0.30%), and St. Louis (+0.29%).
-
The sharpest monthly declines occurred in Las Vegas (-0.60%), Tucson (-0.51%), San Antonio (-0.46%), Tampa (-0.44%), and Phoenix (-0.44%).
-
San Francisco (+5.3%), Chicago (+3.8%), San Jose (+3.2%), Norfolk (+2.7%), and Pittsburgh (+2.7%) led annual rent growth.
-
Austin (-4.3%), Denver (-3.5%), Phoenix (-2.9%), San Antonio (-2.3%), and Tucson (-1.8%) recorded the largest YoY declines, all markets affected by high vacancy and excess new supply.
-
The report highlighted a persistent regional divide, with supply-constrained Midwest and coastal metros outperforming oversupplied Sun Belt markets.
-