
 US PPI
- Source
- BLS
- Source Link
- https://www.bls.gov/
- Frequency
- Monthly
- Next Release(s)
- March 18th, 2026 8:30 AM
-
April 14th, 2026 8:30 AM
-
May 13th, 2026 8:30 AM
-
June 11th, 2026 8:30 AM
-
July 15th, 2026 8:30 AM
-
August 13th, 2026 8:30 AM
-
September 10th, 2026 8:30 AM
-
October 15th, 2026 8:30 AM
-
November 13th, 2026 8:30 AM
-
December 15th, 2026 8:30 AM
Latest Updates
-
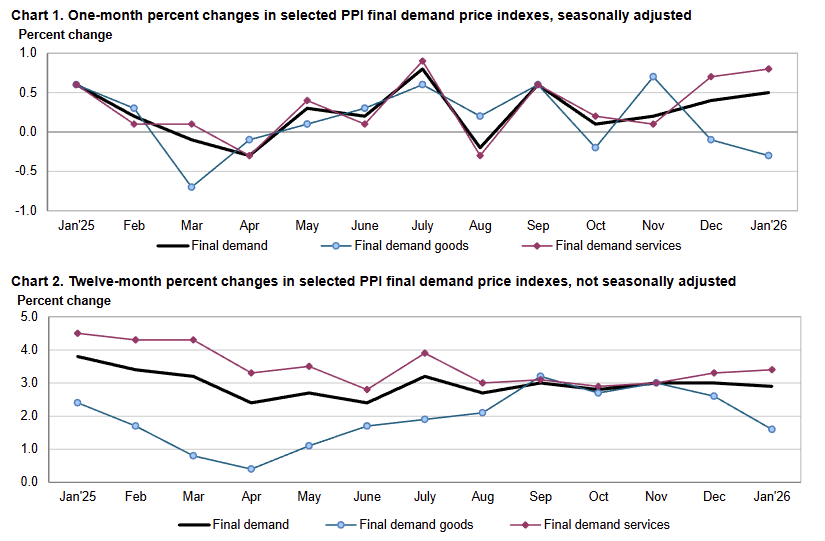
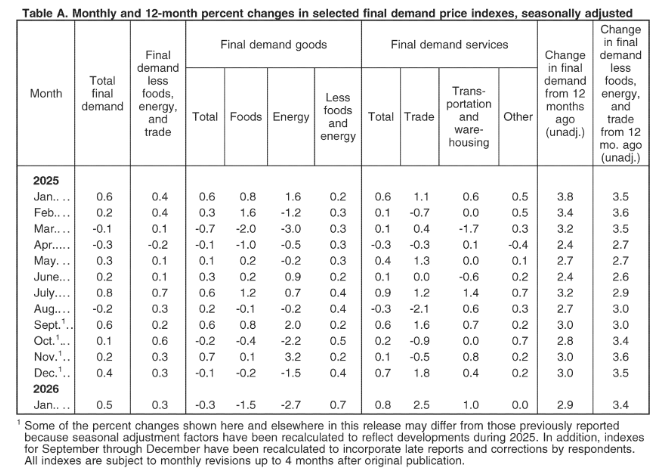
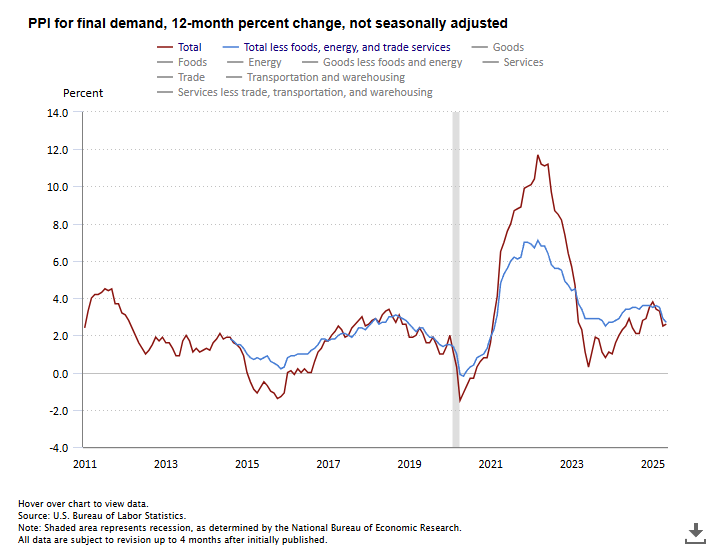
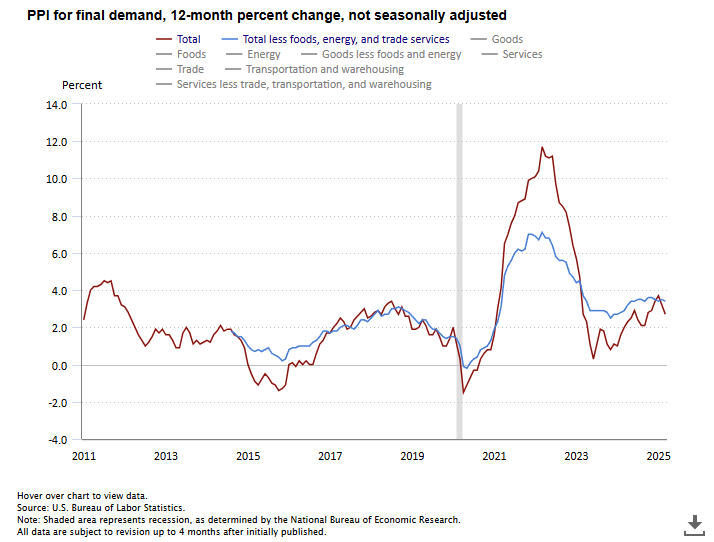
US final demand PPI rose +0.5% MoM (vs +0.3% MoM expected) and +2.9% YoY (vs +2.6% YoY expected) in January 2026, led by services price pressures.
-
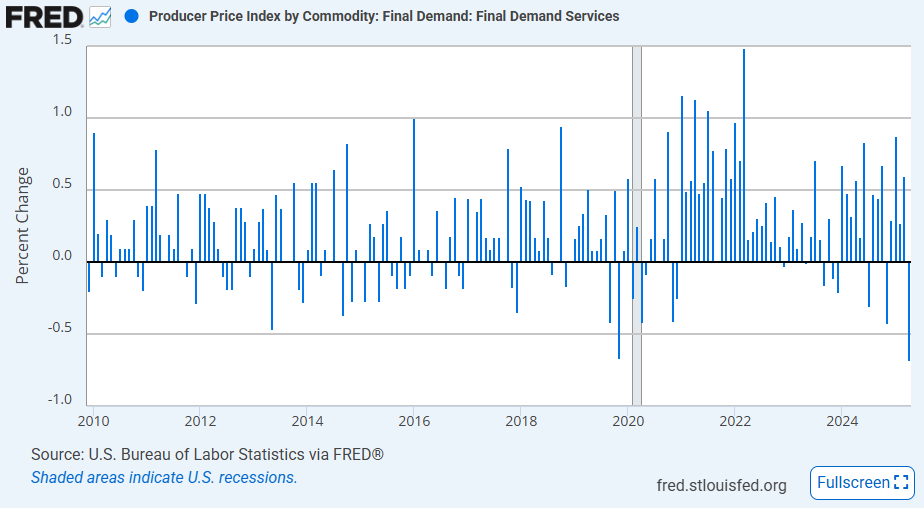
Final demand services increased +0.8% MoM while goods fell -0.3% MoM, showing services were the primary driver of the monthly rise.
-
Core PPI excluding food, energy, and trade services rose +0.3% MoM and +3.4% YoY, marking the ninth consecutive monthly increase.
-
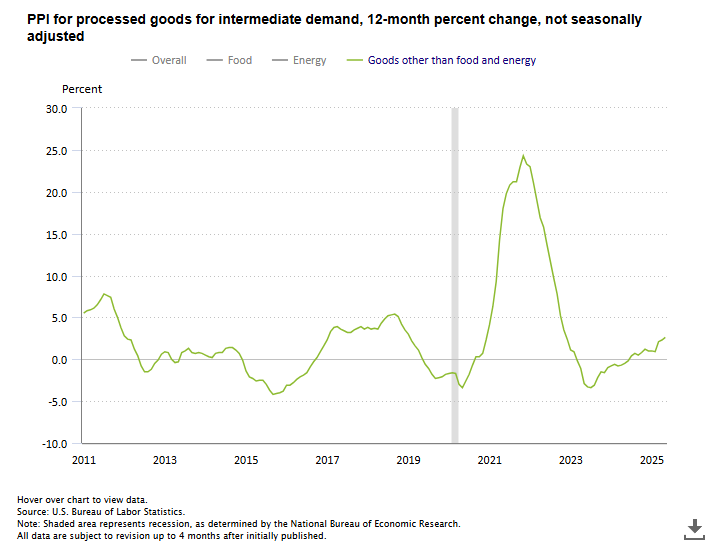
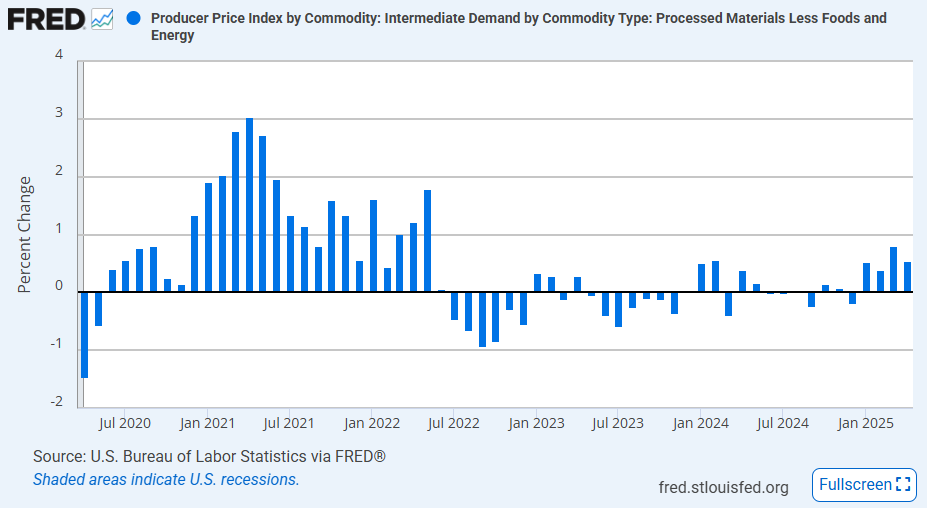
Processed goods for intermediate demand were unchanged MoM and up +2.6% YoY, as a +0.5% rise in core materials offset declines in energy (-2.0%) and foods (-0.6%).
-
Unprocessed goods for intermediate demand fell -0.5% MoM and -6.1% YoY, driven largely by a -3.5% drop in foodstuffs including raw milk (-9.8%).
-
Services for intermediate demand increased +0.3% MoM and +2.9% YoY, the fifth straight monthly rise led by trade margins (+1.6%).
-
Transportation and warehousing services rose +0.5% MoM while margins for chemicals wholesaling jumped +8.4%, contributing significantly to service inflation.
-
Business loan prices fell -7.5% MoM and freight arrangement services declined, offsetting some of the broader services increases.
-
-
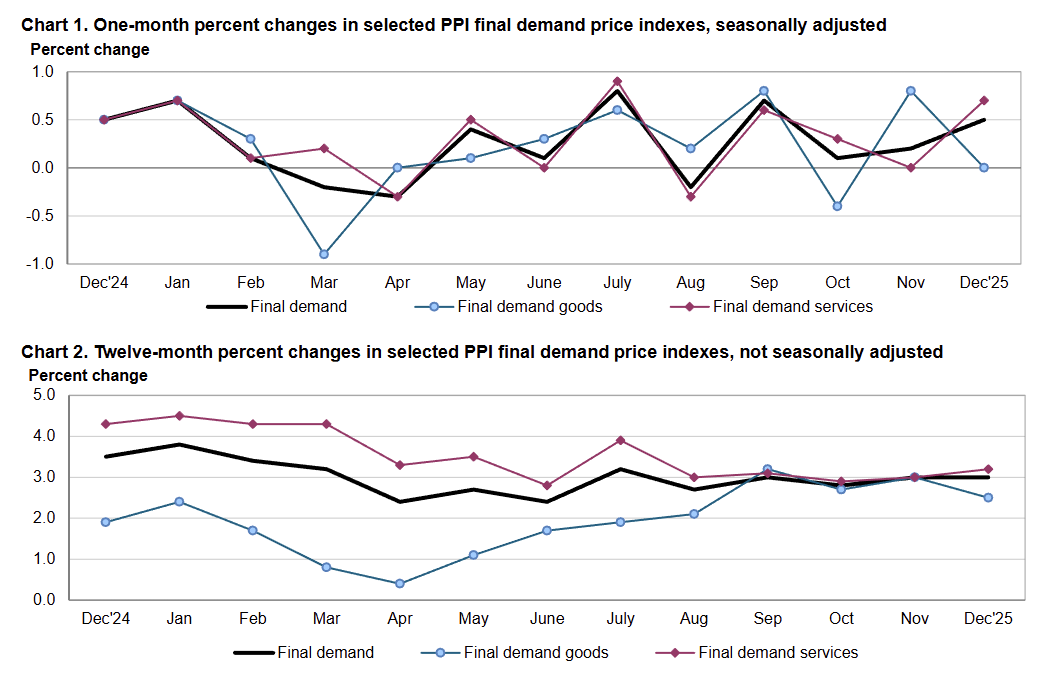
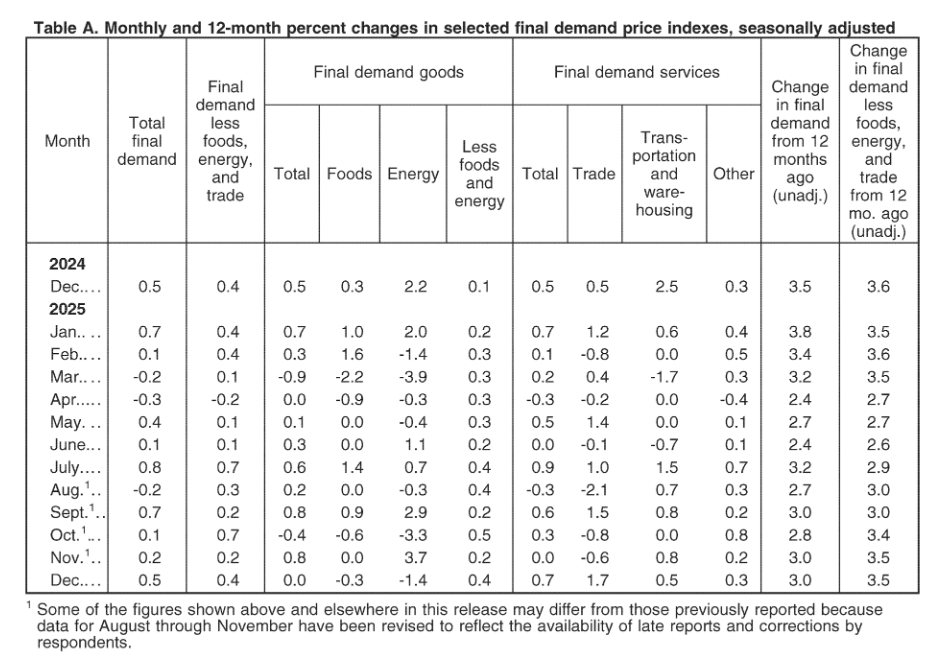
US final demand PPI increased +0.5% MoM (vs +0.2% MoM expected) in December 2025 and rose +3.0% YoY (unchanged from November), reflecting stronger service-sector price pressures while goods prices were flat.
-
Final demand services prices climbed +0.7% MoM, the largest increase since July, with a +1.7% MoM jump in trade margins accounting for roughly two-thirds of the monthly rise.
-
Final demand goods prices were unchanged MoM, as a +0.4% MoM increase in core goods was offset by -1.4% MoM energy and -0.3% MoM food price declines.
-
Core final demand PPI excluding food, energy, and trade rose +0.4% MoM, marking the eighth consecutive monthly increase and pointing to persistent underlying price gains.
-
Within services, margins for machinery and equipment wholesaling surged +4.5% MoM, contributing over 40% of the monthly services increase, while transportation and warehousing rose +0.5% MoM.
-
Processed goods for intermediate demand slipped -0.1% MoM, driven by a -2.4% MoM drop in processed energy goods and -1.3% MoM in processed foods, partially offset by gains in core materials.
-
Unprocessed goods for intermediate demand jumped +2.3% MoM, the largest increase since January, led by +5.5% MoM in unprocessed energy materials, including a +34.8% surge in natural gas prices.
-
Services for intermediate demand rose +0.7% MoM, with most of the increase coming from services excluding trade, transportation, and warehousing, alongside gains in trade and logistics services.
-
-
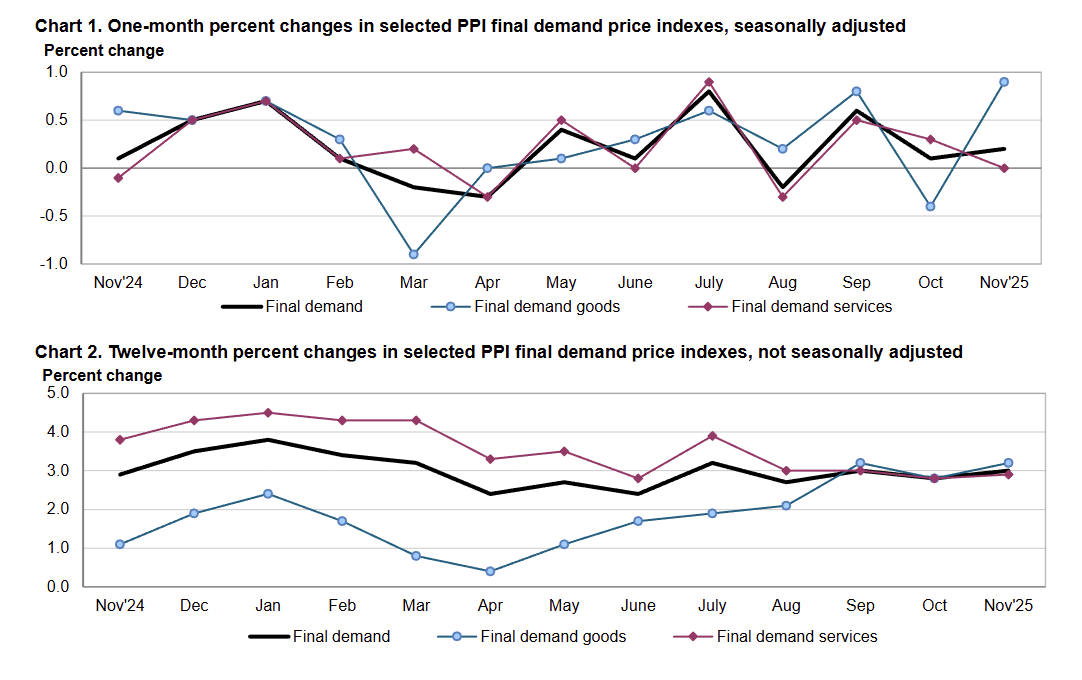
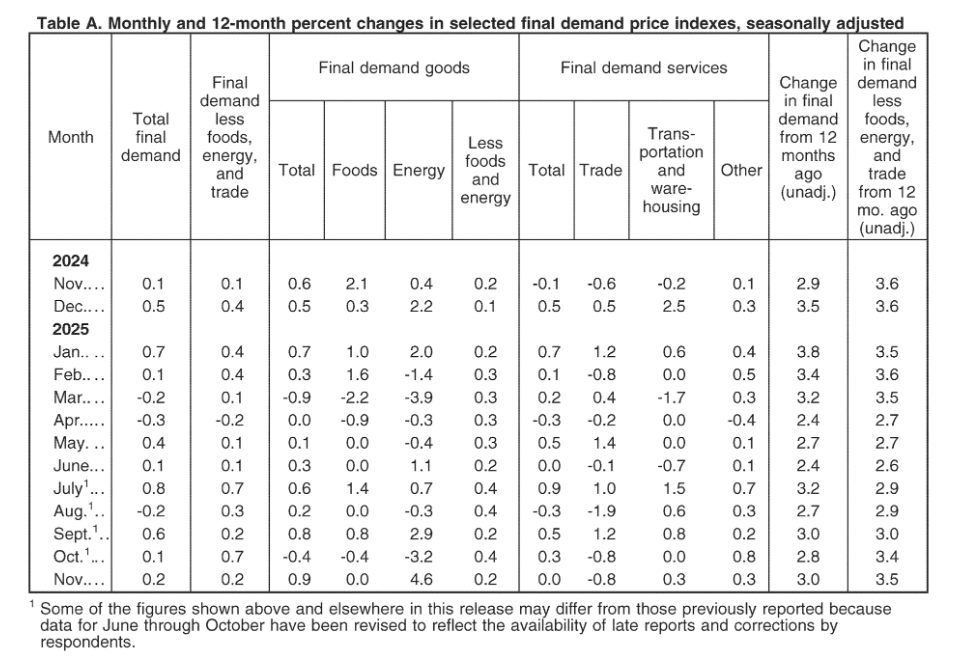
US final demand PPI increased 0.2% MoM (vs 0.2% MoM expected) and 3.0% YoY (vs 2.7% YoY expected) in November, up from 2.8% YoY in October.
- Core PPI was flat (vs +0.2% MoM expected) and up 3.0% YoY (vs 2.7% YoY expected), up from 2.8% YoY previously.
- Goods PPI jumped 0.9% MoM in November on a strong 4.6% MoM increase in energy PPI while core goods PPI was up just 0.2% MoM.
- Services PPI was flat on a monthly basis as trade PPI (tracking wholesale and retail margins) fell 0.8% MoM in both October and November.
- In terms of intermediate demand, processed goods PPI increased 0.6% MoM and 3.6% YoY, almost entirely due to energy.
- Excluding food and energy, the segment was only up 0.1% MoM. Unprocessed goods PPI was up 0.4% MoM as raw input energy and nonfood, nonenergy goods increased while raw food input PPI fell -0.9% MoM.
- Services for intermediate demand PPI increased 0.2% MoM in November, led by a 0.5% MoM increase in the transportation & warehousing segment.
- With rates falling, PPI for business loans saw a large decline of -4.5% MoM.
- BLS also highlighted that “Over half of the increase in the index for services for intermediate demand can be attributed to a 4.2% MoM jump in prices for management consulting services.”
-
U.S. producer prices rose 0.3% MoM in September (+2.7% YoY), marking a rebound from August’s decline and reflecting firmer goods inflation while services remained flat.
-
Final demand goods increased 0.9% MoM, driven mainly by a sharp +11.8% jump in gasoline, with additional support from higher prices for meats, ethanol, natural gas liquids, and structural metal products. This marked the third straight monthly increase in goods prices.
-
Final demand services were unchanged MoM, as a -0.8% decline in trade services margins offset increases in transportation and warehousing (+0.4% MoM). The flat reading follows two months of firmer services inflation.
-
Core PPI (less foods, energy, and trade) edged up 0.1% MoM (+2.9% YoY), easing from August’s +0.3% rise but maintaining a moderate upward trend.
-
Processed goods for intermediate demand rose 0.4% MoM (+3.8% YoY), supported by higher processed energy goods (+0.9% MoM) and processed foods (+1.1% MoM), indicating continued pipeline cost pressure.
-
Unprocessed intermediate goods increased 0.1% MoM, as food/feedstuffs jumped +1.9% and nonfood materials rose +1.5%, while unprocessed energy fell -3.0% MoM, led by natural gas (-8.7% MoM).
-
Intermediate demand services increased 0.1% MoM, with food wholesaling margins up +3.8% MoM accounting for most of the gain; loan services fell -3.4%.
-
Across production stages, intermediate demand inflation remained firm, with Stage 4 (+0.2% MoM), Stage 3 (+0.3% MoM), and Stage 1 (+0.4% MoM) all rising, while Stage 2 edged down (-0.1% MoM), showing broad but varied cost pressures across supply chains.
-
-
US PPI: October 2025 (CANCELED)
-
Following a hot PPI print in July, producer prices saw a surprise move lower in August. The headline PPI index dropped -0.1% MoM last month, well below expectations of a moderate increase of 0.3% MoM. The unexpected cooling led the annual rate to slow to 2.6% YoY in August, the lowest since September 2024. In addition to the decline in August, the BLS noted a revision to the July print from the initial report of a 0.9% MoM increase to second estimate of 0.7% MoM as both monthly goods PPI and services PPI growth rates were adjusted lower. The broad headline indexes suggest there was a significant easing in producer price pressures after they ramped up in July, but the details suggest weakness was centered in one area.
Goods
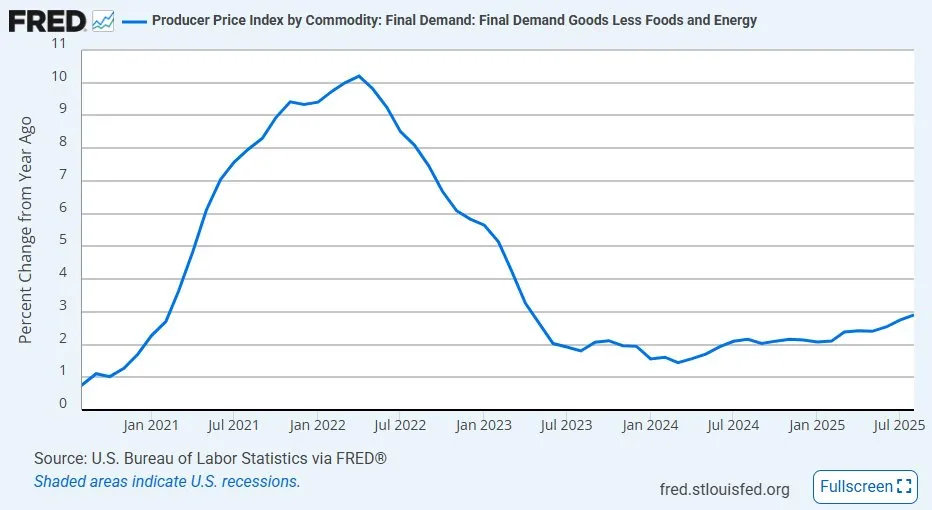
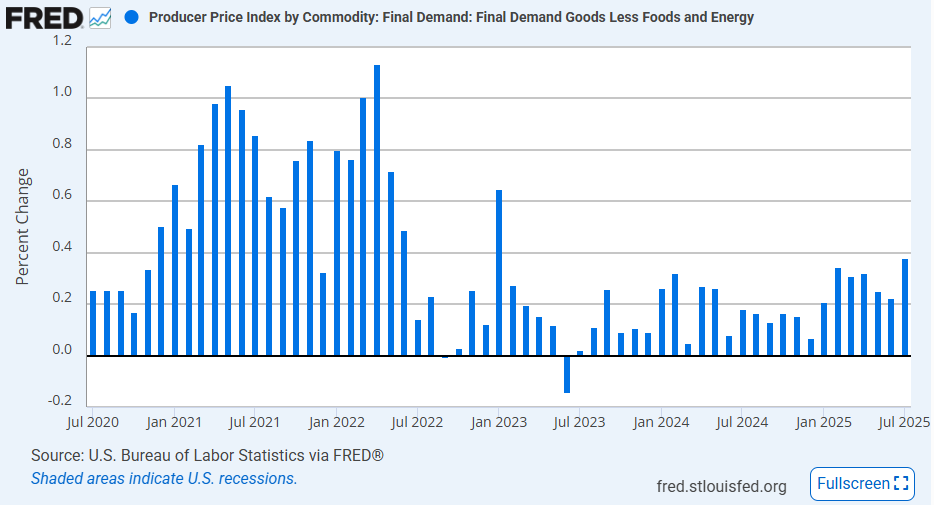
Final demand goods PPI saw a slight increase of 0.1% MoM in August, a significant slowdown from the 0.6% MoM increase in July. However, the segment did see a significant impact from weakness in final demand energy goods, which fell -0.4% MoM. When excluding foods and energy, core final demand goods PPI increased 0.3% MoM, continuing a trend of moderate core gains since Q1 2025. On an annual basis, core goods PPI was up 2.9% YoY in August, up from 2.7% YoY in July and the highest since April 2023. So as we can see, there is some meaningful divergence within the goods segment of PPI to dissect.
- Energy PPI was a key area of weakness dragging the headline PPI and top line goods PPI indexes lower. It fell -0.4% MoM in August after two strong rises in June and July. Within the segment, natural gas liquids (-5.9% MoM), residential natural gas (-1.4% MoM), and gasoline (-0.6% MoM) all saw sizeable MoM declines. The easing in energy goods was driven by lower energy unprocessed goods which fell -2.5% MoM and accounted for 75% of the -1.1% MoM decline in the overall unprocessed goods index.
- Food PPI saw a slight increase of 0.1% MoM, not affecting the August rate much, but this was a significant slowdown from the 1.4% MoM increase in July. There was some divergence in the processed and unprocessed segments with the former up 1.0% MoM and the latter down -0.3% MoM. On an annual basis, final demand food PPI eased to 3.5% YoY, down from 4.1% YoY.
- Outside of these two segments, core goods producer prices continued moderate gains. Core consumer goods increased 0.4% MoM, the largest increase since February and the 2nd largest since January 2023, which was driven by a 0.5% MoM increase in core nondurable consumer goods. Private capital equipment PPI increased 0.2% MoM, slightly slower than July.
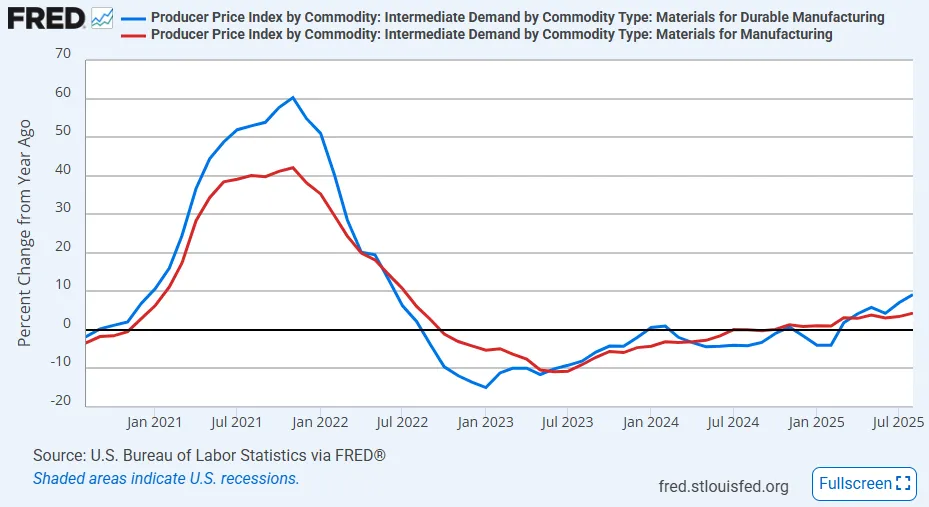
- Some subsegments that continue to show the impact of tariffs on goods can be found in the PPI for processed goods for intermediate demand (up 0.4% MoM in August). Costs for manufacturing materials were up 0.6% MoM in August, matching a hot July pace. The largest increase was within durable manufacturing where costs for materials are up 0.8% MoM and 9.1% YoY. The annual increase of that subsegment was the highest since June 2022.
Services
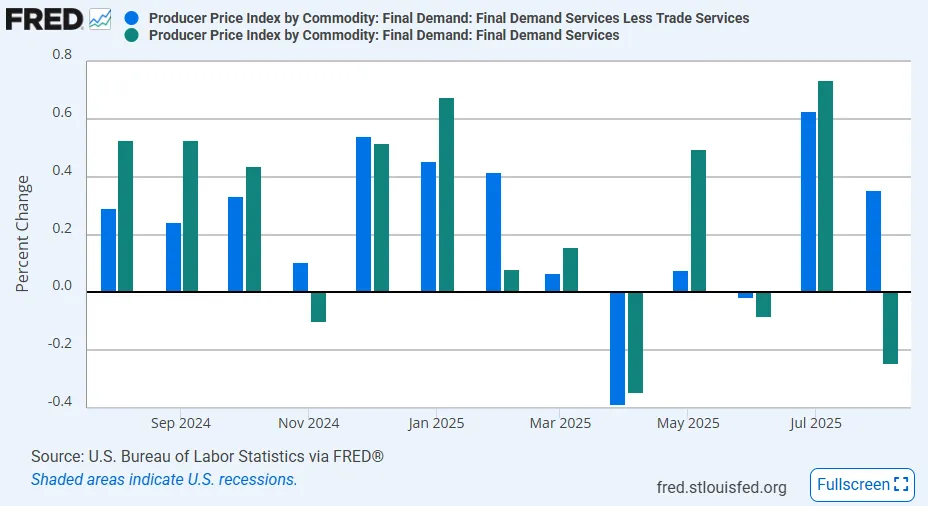
Final demand services was the weaker segment driving the headline PPI index to decline in August, falling -0.2% MoM. This was the largest monthly decline since April. The move was heavily affected by the trade services segment which overcorrected a strong move in July. A second straight hot print in transportation and warehousing offset some of the weakness in trade services. When excluding trade services, final demand services PPI actually increased 0.4% MoM, building on a hot 0.6% MoM increase in July.
- The trade services segment declined -1.7% MoM in August, more than reversing the 1.0% MoM increase in July. This represents a significant decline in margins for wholesalers and retailers after a bump up in the month before. The decline was evident across personal consumption goods trade services (-1.4% MoM) and private capital equipment trade services (-3.1% MoM). Additionally, exporters saw their margins decline by -1.8% MoM. It is worth noting that declines in this segment do not say much about the impact in tariffs. Margins don’t necessarily have to rise along with costs related to tariffs if retailers take on some of those costs instead of passing them on to consumers.
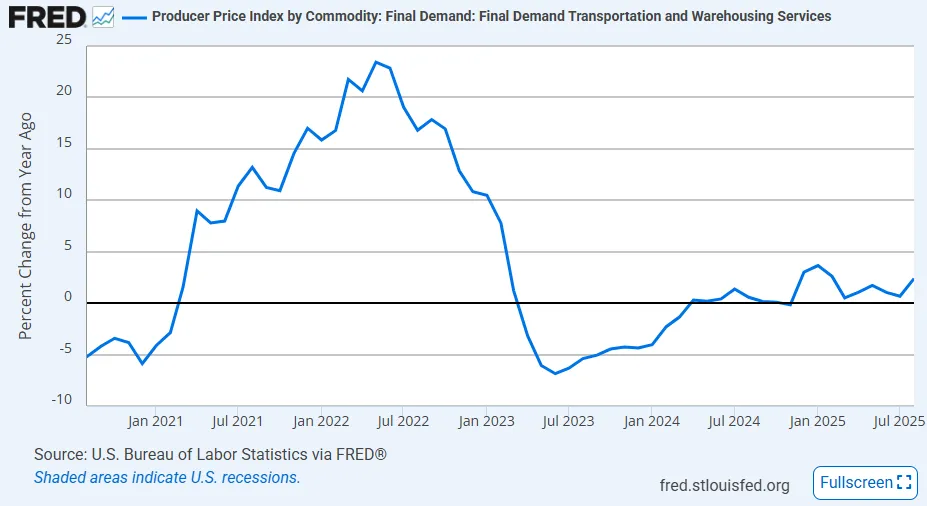
- PPI for transportation and warehousing services saw a robust 0.9% MoM increase in August, matching the pace in July. Like trade services, the move was seen across every subsegment. Costs for passenger transportation increased 1.0% MoM, and costs for transportation and warehousing of goods also increased 1.0% MoM. The hot prints over the past two months are not necessarily unusual, however, since these segments saw sharp declines in Q2 after trade activity dropped in the aftermath of the frontrunning of tariffs. Transport and storage costs are now starting to stabilize as tariff policy becomes more settled and trade picks back up. The longer-term annual increase in transport and storage services PPI is 2.4% YoY, around pre-pandemic averages.
Many will look at the headline movement in the PPI and conclude that inflationary pressures cooled in August, but the details show a more mixed situation. Excluding energy, producer prices for goods continued to increase with finished goods up at a moderate pace and manufacturing inputs up at a pretty hot pace. The services PPI was also heavily impacted by one subsegment, trade services, which showed a decline in margins for retailers and wholesalers. While this does suggest that price rises further down the supply chain might be contained, it doesn’t mean that costs are falling. With consumers becoming increasingly weak due to more pessimism and weaker employment prospects, it would not be a surprise to see margin growth not fully compensate for the increase in costs from tariffs earlier in the supply chain.
-
Headline PPI
The headline US final demand PPI printed very hot in July, rising 0.9% MoM and beating the forecast of a 0.2% MoM by a substantial margin. This move is the largest monthly gain since one of an equal size was reported in June 2022. On an annual basis, headline PPI was up 3.3% YoY, a reacceleration from the weaker prints of the three months before and the highest since February of this year. Even when excluding food and energy, PPI was still up 0.9% MoM, which is also the highest reading for that segment in over three years.
Goods
The goods segments are the focus for analysts poring over the latest data as they look for evidence that tariffs are impacting prices. The July report might give them just that. The final demands goods PPI jumped 0.7% MoM, the largest increase since January, but more importantly, the core goods PPI was up 0.4% MoM, the largest increase since January 2023. But first, let’s look at the volatile components:
- The final demand energy goods segment increased 0.9% MoM for the second straight month in July. Energy prices were low for the first half of the year, and are starting to show signs of reflating (though not to a significant degree). In the July report, the subindexes tracking government purchased energy goods (+4.9% MoM) and exported energy goods (+4.5% MoM) saw very large gains which offset a slight decline of -0.1% MoM in finished consumer energy foods. The key thing to note is that energy will not be a significant source of deflation going forward and will, at best, remain flat.
- The final demand foods segment jumped 1.4% MoM in July, the largest since a 1.6% MoM rise in June. Apparently, a surge in vegetable prices played a major part in the strong rise in food prices and even in the overall goods segment: “A quarter of the July advance in the index for final demand goods can be traced to prices for fresh and dry vegetables, which jumped 38.9% MoM.” There were also hot prints for eggs (+7.3% MoM), beef & veal (+4.6% MoM), and processed turkeys (+5.1% MoM). Coffee increased another 1.1% MoM and is now up 29.2% YoY. The surge there and in the vegetable index do appear to be evidence of tariff impacts.
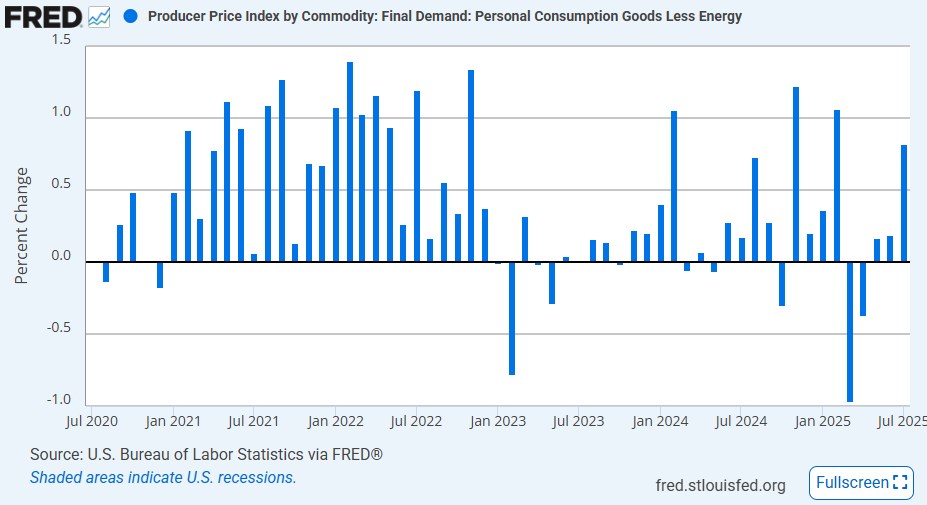
Outside of the two volatile components, there were several categories that suggested tariffs were increasing costs for producers. The subindex tracking iron & steel scrap increased 4.5% MoM in July, building off of the 3.2% MoM rise in June. Steel has been targeted specifically with a steep 25% tariff. Home electronic equipment PPI surged 5.0% MoM after a 0.8% MoM rise previously and is now up 6.5% YoY. Other nondurable goods categories that are related to consumer goods imports saw strong rises as well: textile house furnishings (+2.3% MoM), sporting & athletic goods (+1.2% MoM), household furniture (0.4% MoM), and household appliances (+0.6% MoM). The general move is summarized well by the personal consumption goods (less energy) PPI which increased 0.8% MoM in July, the strongest move since a 1.1% MoM rise in February, when the first tariffs were introduced.
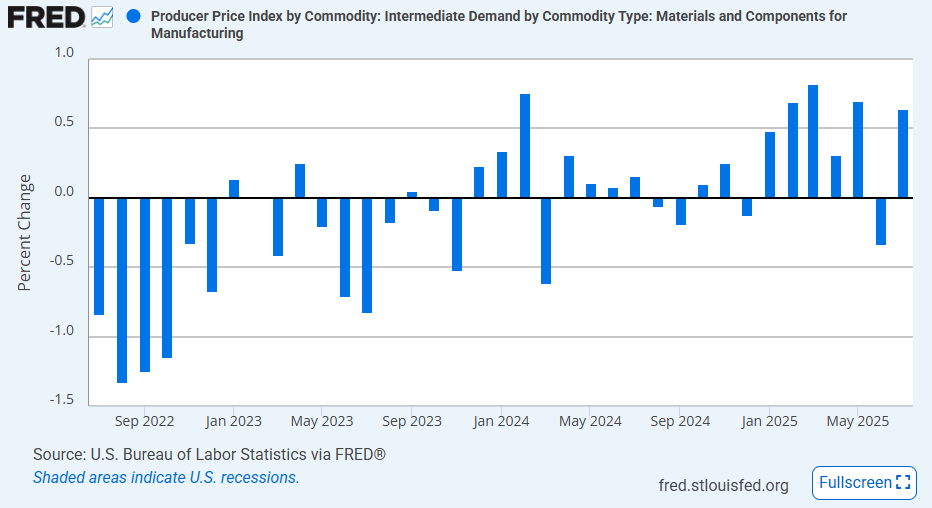
The impacts were not only evident in the finished goods price data, but also in the intermediate goods price data. Both the PPI for processed intermediate goods and the PPI for unprocessed intermediate goods increased in July, by 0.8% MoM and 1.8% MoM, respectively. This includes increases in the costs of goods flowing into US manufacturing firms. The materials for manufacturing index increased 0.8% MoM driven by a 1.3% MoM rise in materials for durable manufacturing (which is now up 7.2% YoY). Unprocessed material costs (ex food and fuels) have seen robust gains in the last two months as well, up 3.3% MoM in June then 1.1% MoM in July. The report today shows that tariff impacts are showing up across all segments of the supply chain.
Services
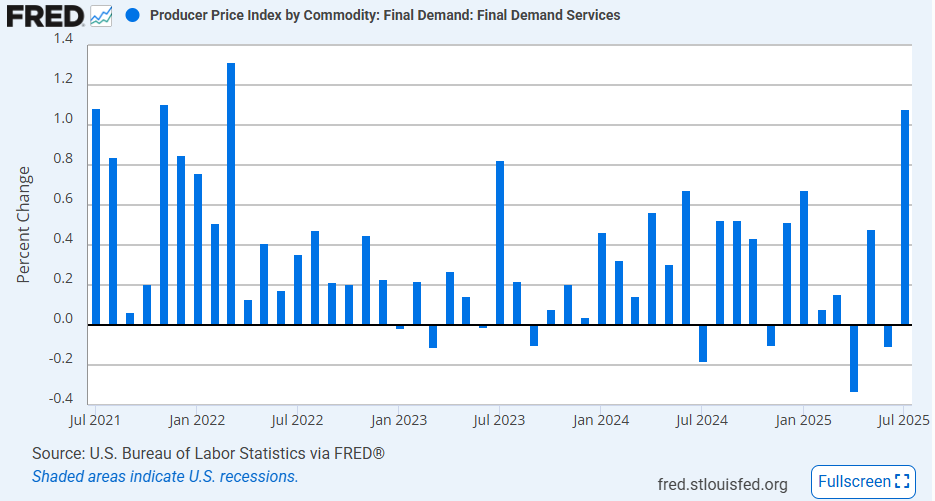
Alongside the rise in goods PPI was an even larger rise in the services PPI. Final demand services PPI increased 1.1% MoM, the largest increase in over three years. On an annual basis, final demand services was up 4.0% YoY in July, a sharp acceleration from 2.7% YoY in June. PPI of services for intermediate demand also saw a hot print, up 0.8% MoM, the strongest increase since January 2023. What stuck out as being a reaction to tariffs in the services PPI data was a sharp increase in trade services PPI.
Final demand trade services surged 2.0% MoM in July and accounted for over half of the rise in the overall services PPI move. More specifically, 30% of the overall services PPI rise is attributed to a 3.8% MoM increase in margins for machinery and equipment wholesaling. This sharp gain in wholesale margins reflects both stronger demand in certain capital goods markets and rising replacement costs tied to tariff-affected imports. Recent tariff rounds have increased the landed cost of many machinery components and finished equipment sourced from abroad, prompting wholesalers to lift margins to protect profitability. As these higher input costs work their way through supply chains, they are likely to place additional upward pressure on producer prices, and potentially consumer prices, in the coming months.
-

US PPI for final demand was flat (vs 0.2% MoM expected) on a monthly basis and up 2.3% YoY in June, down from 2.7% YoY in May and the lowest since September 2024.
- Core PPI (excluding food, energy, and trade services) was also flat MoM and up 2.5% YoY, down from 2.8% YoY previously and the lowest since November 2023.
- Final demand goods PPI rose 0.3% MoM, driven by a 0.3% increase in core goods, a 0.6% rise in energy, and a 0.2% gain in food.
- Final demand services PPI fell -0.1% MoM, led by a -4.1% drop in traveler accommodation; trade margins were flat, and transportation services dropped -0.9%.
- Processed goods for intermediate demand edged up 0.1% MoM and 1.9% YoY, with natural gas to electric utilities rising 12.1%.
- Unprocessed goods for intermediate demand rose 0.7% MoM but fell -1.3% YoY; natural gas and slaughter cattle prices increased, while chicken eggs fell -25.0%.
- Services for intermediate demand declined -0.1% MoM but rose 1.4% YoY; deposit services fell -5.4%, while freight forwarding jumped 8.0%.
-
The headline PPI index rose 0.1% MoM in May after falling -0.2% in April and -0.1% in March. On a YoY basis, final demand PPI increased 2.6%, while the core PPI (excluding food, energy, and trade services) was up 2.7% YoY.
- Final demand goods PPI rose 0.2% MoM, with core goods also up 0.2% MoM; food rose 0.1% MoM and energy was flat.
- Final demand services PPI increased 0.1% MoM, driven by a 0.4% rise in trade services margins; transportation services fell -0.2% MoM.
- Core PPI (less food, energy, and trade services) edged up 0.1% MoM after a -0.1% decline in April.
- Intermediate demand processed goods rose 0.1% MoM; unprocessed goods fell -1.6% MoM, largely due to an -18.7% drop in natural gas prices.
- Core processed goods for intermediate demand PPI has posted some hot MoM readings since tariffs were put in place. On an annual basis, the segment is up 2.6% YoY, the highest since November 2022.
- Prices for services for intermediate demand increased 0.1% MoM, with a 0.7% rise in trade services partially offset by -0.1% declines in other components.
-
The headline PPI index fell -0.5% MoM, a big miss below the consensus estimate of a 0.2% MoM increase. The decline is the first since October 2023 and the largest since producer costs crashed during the pandemic in April 2020. On an annual basis, the rate of growth fell to 2.4%, down from 3.4% in March and the lowest since September 2024. The drop in April was not evident across all categories as some segments have larger impacts than others.
Final demand goods PPI was unchanged in April, mostly due to declines in food and energy costs, which fell -1.0% MoM and -0.4% MoM respectively. Eggs continued to be a standout category, dropping -39.4% MoM. Excluding those two segments and final demand goods, PPI was up 0.4% MoM, one of the strongest increases in over a year. The increase in that core segment was seen across both consumer goods and capital goods, up 0.3% MoM and 0.6% MoM. The rise in finished goods costs is being driven by strong gains in core intermediate goods cost,s which increased 0.7% MoM and 0.5% MoM in the last two months (both gains are the highest since the 2021-2022 post-COVID supply chain crunch). These increases are likely coming as a result of the tariffs put in place in February and March.
Final demand services PPI looks have been the main driver of the headline decline, falling -0.7% MoM, as all of its subsegments fell in April. Notably, this is the largest decline in final services PPI since the series began in December 2009. The largest decline was seen in the final demand trade services segment which fell -1.6% MoM and accounted for over two-thirds of the overall services PPI drop. The move here points to a significant decline in retail and wholesale margins in April that was probably driven by higher tariff rates. Additionally, the transportation and warehousing services segment dropped by -0.4% MoM, likely a result of trade and travel cooling in the wake of US trade policy changes.
The PPI report as a whole looks deflationary, but there are key differences within the data to point out. Food and energy, the two volatile segments, were important deflationary factors that actually hide some of the inflationary pressure from tariffs in finished consumer and capital goods costs. The services side was the main reason for the PPI decline through the sharp decline in the trade segment. That specific move is a bit deflationary in that it suggests that retail and wholesale firms are eating some of the higher costs from tariffs for now, but that could shift if trade services firms are not able to survive the margin compression.
-
Following the cold CPI release yesterday, the headline PPI fell more than expected in March, recording the largest decline in more than a year. The final demand indexes were heavily affected by energy prices and softening consumer demand, with little impact from tariffs. On the other hand, the intermediate demand indexes did show evidence that higher import duties have already pushed up costs in the early stages of the supply chain.
Headline PPI
The headline PPI recorded a decline of -0.4% MoM in March, well below expectations of an increase of 0.2% MoM and the largest decline since October 2023. The annual rate of the index cooled for the second straight month, down to 2.7% YoY, the lowest since September 2024. The decline in the index was driven by two segments:
- Just as we saw energy have a significant impact on the CPI release yesterday, the energy index played a major role in the PPI release. The final demand energy index was down -4.0% MoM in March and, like the headline MoM move, it was the largest decline since October 2023. The BLS points out that “over three-fourths of the March decline is attributable to [the] -4.0% drop in the index for final demand energy.” More specifically, it attributes two-thirds of the decline to the -11.1% MoM drop in gas prices.
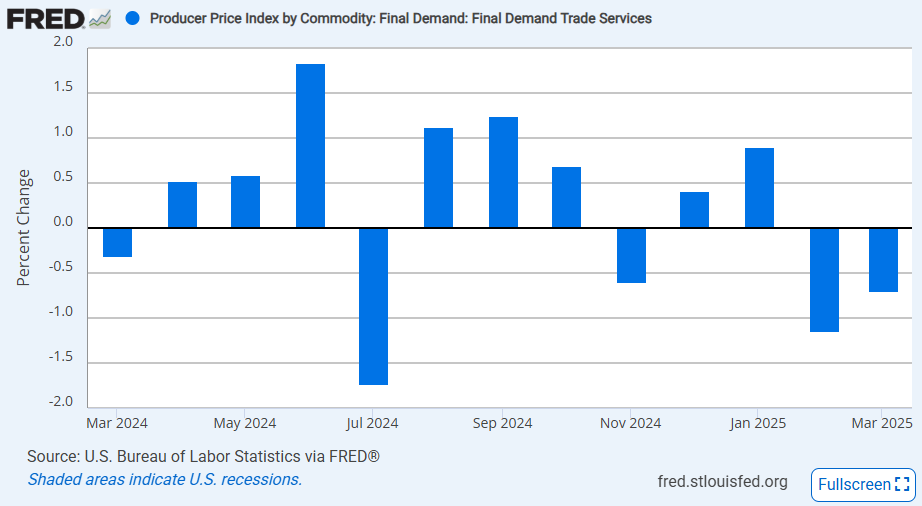
- Within the services PPI segment, there was a large decline in the index tracking trade services (-0.7% MoM) which is associated with margins in wholesale and retail trade. This followed a large -1.1% MoM decline in February and caused the annual increase to fall to 3.1% YoY, the lowest since November 2024. The margin compression in March likely came as a result of the decline in consumer prices in March and doesn’t necessarily point to a decline in costs for producers.
Final Demand PPI
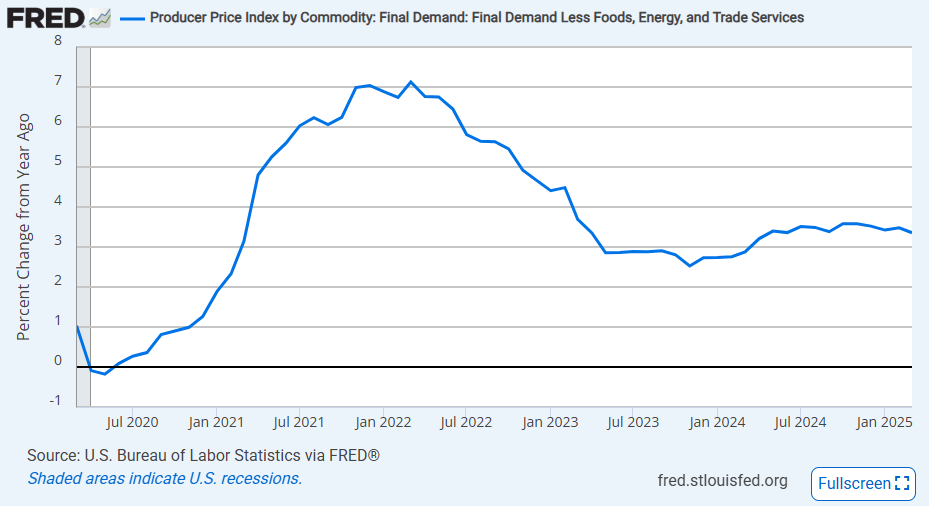
While the energy and trade services indexes played a major role in the decline in the PPI index in March, cost growth broadly was soft. Final demand PPI excluding foods, energy, and trade services was only up 0.1% MoM in March, slowing from three straight increases of 0.4% MoM. On an annual basis, the aggregate was up 3.4% YoY, down from 3.5% YoY and the lowest since June 2024.
One of the softest final demand segments in March (not including energy and trade services) was transportation and warehousing services. It fell -0.6% MoM, the largest decline since August 2024. The drop was caused by a large -3.9% MoM move in passenger transportation costs that is similar to the drop in airfares seen in the March CPI report. This was partially offset by a rise of 0.5% MoM in the cost of transporting foods which has a slightly higher weight. It’s likely that the decline in passenger transport costs was a result of lower fuel costs and weaker demand for travel as consumers backed off of discretionary spending.
Did the early tariffs on Canada, Mexico, and China impact the final demand indexes? It doesn’t look like there was much of a reaction. The March data for final demand appears to have been more impacted by the weakness in consumer prices and consumer spending. This is most strongly supported by the move in trade services PPI. It is possible that the slight rise in goods transport and warehousing costs may be an early reflection of tariff costs entering the supply chain, but that is unclear.
Intermediate PPI
While the final demand indexes did not show much of an impact from the early tariffs, there were more interesting moves in the intermediate PPI indexes. These indexes are different from the PPI readings that make the headlines as they show the change in costs earlier in the supply chain. Here are some intermediate segments to note in today’s release:
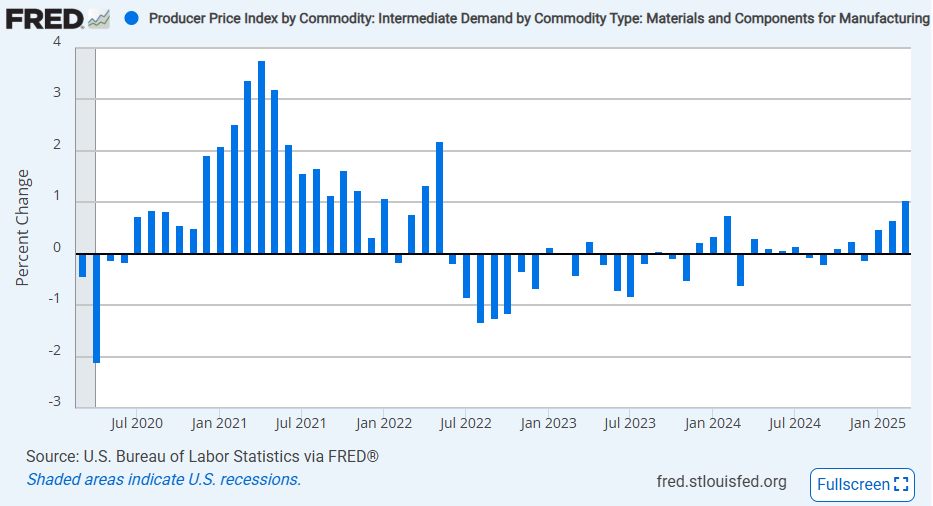
- The PPI for materials and components for manufacturing jumped 1.0% MoM in March, the largest monthly increase since May 2022. A string of strong increases in Q1 2025 sent the index up 1.3% QoQ, the highest since Q2 2022. The new trend in the last three months suggests that this increase is at least somewhat linked to tariffs. Within the index, materials for durable manufacturing increased 1.4% MoM in February and 3.1% MoM in March. These unusually high gains likely represent a sudden increase in costs for the materials needed for auto & other transport goods manufacturing.
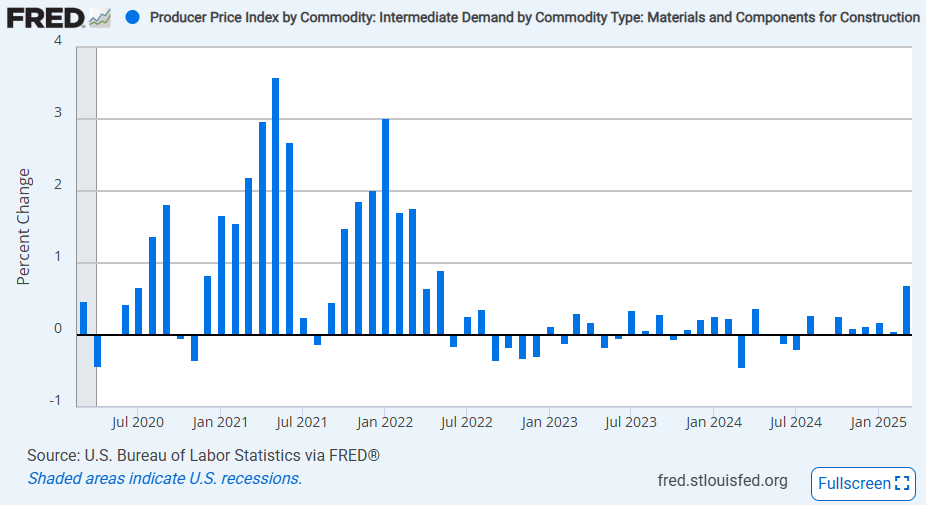
- Data for March suggested that there was also an increase in materials and components needed for construction. That index increased 0.7% MoM in March which is the largest rise since May 2022 as well. With Canada being a major source of lumber and Mexico a major source of gypsum, tariffs on these goods likely drove the increase seen here.
- The BLS discusses some of the details of the rise in intermediate processed goods costs: “Among prices for processed goods for intermediate demand in March, the index for steel mill products rose 7.1% MoM. Prices for structural, architectural, and pre-engineered metal products; primary basic organic chemicals; industrial electric power; and plastic resins and materials also moved higher.” These were all offset by a -11.1% drop in gasoline prices.
Goods Inputs PPI by Production Stage Inputs for Goods Producers Inputs for Services Producers Stage 1: Goods (ex-Food, Energy) +1.3% MoM +0.4% MoM Stage 2: Goods (ex-Food, Energy) +0.8% MoM +0.2% MoM Stage 3: Goods (ex-Food, Energy) +1.5% MoM +0.8% MoM Stage 4: Goods (ex-Food, Energy) +0.5% MoM +0.3% MoM The BLS breaks down PPI for intermediate goods by production stage. This breakdown shows that the largest increase in costs was earlier on in the supply chain (stage 1 is the earliest, stage 4 is closest to final demand), and demonstrates the early impact of tariffs on US producers. It’s likely that these costs will continue to be pushed down the supply chain and eventually reach consumers.
-

US PPI growth came in soft in February after a cool CPI report suggested that inflationary pressures were abating at the beginning of the year. The headline PPI index was flat on a monthly basis in February and up 3.2% YoY, well below expectations of a 0.3% MoM increase. Core US PPI, which excludes food and energy, was down -0.1% MoM and up 3.4% YoY, below the 0.3% MoM increase that was expected. The soft readings were helped by a decline in energy prices, a reversal of the increase in trade services costs in January, and moderating services costs from diminishing macro conditions. However, these were offset by an increase in core goods, especially food (egg) prices.
Goods
The goods segment of PPI was mixed with large swings in the volatile category paired with a moderate increase in the core segment. Overall, final demand for goods prices increased 0.3% MoM, the lowest in four months.
- Producer prices for foods jumped 1.7% MoM in February, building on a 1.0% YoY increase in January. The segment was largely impacted by producer prices for eggs which actually surged 53.6% MoM in February and ended up accounting for about two-thirds of the February monthly gain in goods PPI. The bird flu also had an impact on turkey prices which were up 8.6% MoM in February, but the impact was much weaker. Outside of eggs and turkeys, food PPI was pretty mixed.
- Offsetting the rise in foods was a drop in energy PPI of -1.2% MoM in February after two months of strong monthly increases. The biggest impact was in the gasoline index which fell -4.7% MoM and -8.2% YoY, and adding to that was a -9.8% MoM decline in the home heating oil index as costs receded after an unusually cold January. Energy costs are now down -3.7% YoY on the year, with the only major upward pressure being natural gas prices which are being pushed higher due to low inventories.
- Goods PPI excluding energy and goods was up 0.4% MoM which is actually the largest monthly increase since January 2023. The largest monthly increase was in iron and steel scrap, up 8.6% MoM, as it bounced back from three straight monthly declines. Producer prices for cigarettes (+2.6% MoM) and jewelry (+2.4% MoM) also saw sizeable increases with both goods up over 10%+ on an annual basis.
Overall, the move in goods producer prices was a little hot and may have generally been impacted by the expectations that tariffs are going to increase prices in the near future. The index of personal consumption goods excluding energy posted a strong monthly gain of 1.1% MoM and was up 4.0% YoY suggesting there is likely to be some upward pressure on CPI in the coming months. It looks like tariffs will remain in place for all of March, so we will also see how PPI reacts in the next report. The key exception is that the effects of the bird flu are likely to wane as we have already seen spot egg prices peak in March. Thus, food PPI will be much cooler.
Services
The surprise in the PPI report came on the services side. Final demand for services PPI actually fell -0.2% MoM in February, the lowest monthly print since July 2024. This caused the annual rate to slow to 3.9% YoY after it had accelerated to 4.4% YoY in January. The decline looks to have been driven by trade costs dropping after a rise in January as firms tried to get ahead of tariffs.
- The trade services PPI was down -1.0% MoM in February, reversing from a 1.2% MoM gain in January. Several subsegments followed this trend: machinery and vehicle wholesaling (Jan: +4.9% MoM, Feb: -1.4% MoM), food and alcohol retailing (Jan: +2.8% MoM, Feb: -2.0% MoM), automobiles retailing (Jan: +3.6% MoM, -3.8% MoM), furniture retailing (Jan: +4.8% MoM, Feb: -4.3% MoM), and major household appliances retailing (Jan: +1.2% MoM, Feb: -6.0% MoM). In fact, the BLS notes that the decline in machinery and vehicle wholesaling costs accounted for over 40% of the overall services move. If tariffs do remain in place, costs should go back to increasing as firms look to pass on the tariff charges down the supply chain.
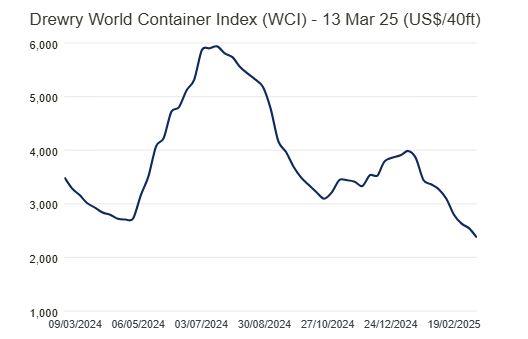
- Transportation and warehousing costs were flat in February due to softness across all segments of freight. Trucking (-0.1% MoM) and air (-1.2% MoM) freight costs were lower and rail freight costs were unchanged. The slowdown in global trade, especially US trade, is causing this decline in freight costs as seen in Drewry’s reports on container rates which note that ports are noting spare shipping capacity from weaker macro conditions globally and volatile US trade policy. This is also helped indirectly by lower fuel costs which was shown through the trend in energy PPI.
- Non-trade, non-transport services PPI was up 0.2% MoM, a moderate monthly increase that is consistent with a trend of a gradual easing in service sector activity. A decline in bond rates caused a notable -2.5% MoM decline in consumer loan costs after they had jumped 2.9% MoM. Investment services costs also fell, down -0.8% MoM and were down -0.6% YoY. There was also a large -4.0% MoM decline in car rental services costs which was a reversal of two months of gains.
The services component of PPI was heavily impacted by the unusual flow of trade in January and a sense that macro conditions are starting to deteriorate. The index tracking personal consumption services (ex-trade services) posted its lowest monthly increase since September 2024 as the recent period of hot readings has come to an end. Will this flow further into lower services CPI? That remains to be seen. The index is still up 3.3% YoY but is trending in the right direction.